Churn Rate vs Retention Rate - What's the Difference and Why It Matters
Understanding the difference between churn rate and retention rate, how to calculate both, and why tracking both metrics matters for your business growth
You're sitting in a product review meeting. Someone throws out a number: "Our churn rate is 5% this month."
Everyone nods. But is that good? Bad? Should you panic or celebrate?
Understanding churn and retention is a critical part of web analytics and understanding the full customer lifecycle.
Here's the thing - churn rate and retention rate are two sides of the same coin. Most people treat them interchangeably. But they're not quite the same, and understanding the difference changes how you interpret your data.
In this article, we'll break down what each metric means, how to calculate them, and more importantly - why you should be tracking both.
What is Churn Rate?
Churn rate measures the percentage of customers you've lost during a specific period.
If you started the month with 100 customers and 5 left, your monthly churn rate is 5%.
Mathematically:
Churn Rate = (Customers Lost During Period / Customers at Start of Period) x 100Why does it matter? Churn is the enemy of growth. A high churn rate means you're burning through customers faster than you can acquire them. You can acquire customers all day, but if they're leaving out the back door, you're stuck on a treadmill.
For SaaS companies, churn hits different. A 5% monthly churn rate compounds - it means roughly 46% of your customer base leaves in a year. That's brutal.
Example: A SaaS with a Churn Problem
Let's say you're running an analytics startup (hypothetically):
- Month 1: 100 customers
- Monthly churn: 5%
- Month 2: 95 customers
- Month 3: 90 customers
- Month 4: 85 customers
- By month 12: You've dropped to 54 customers
Even if you acquire 50 new customers each month, you're just replacing what you lost. No net growth.
What is Retention Rate?
Retention rate is the inverse. It measures the percentage of customers you kept during a period.
If you had 100 customers at the start of the month and 95 remained, your retention rate is 95%.
Mathematically:
Retention Rate = (Customers at End of Period / Customers at Start of Period) x 100Or more directly:
Retention Rate = 100 - Churn RateWhy does it matter? Retention is a leading indicator of product-market fit. Happy customers stick around. If your retention rate is climbing, it means customers are finding value. If it's dropping, something's broken - either your product, your onboarding, or your pricing.
Example: The Same Company, Different Perspective
Using the same numbers:
- Month 1 retention: 95%
- Month 2 retention: 95%
- Month 3 retention: 95%
Looks fine, right? But 95% monthly retention compounds just as aggressively as 5% churn. They're mathematically identical, but retention feels more positive. And that matters for how you think about your business.
The Key Difference: Perspective
Here's where it gets interesting. Churn and retention measure the exact same thing from opposite angles.
Churn focuses on loss. It's the failure metric. When your CEO asks about churn, they're really asking: "How badly are we bleeding customers?"
Retention focuses on success. It's the victory metric. When your product team optimizes retention, they're asking: "How do we keep customers coming back?"
Same data, different stories you can tell yourself.
Why Both Matter
Churn is about sustainability. If your churn is too high, your business dies. Period. You need to understand and minimize it.
Retention is about growth. If your retention is too low, growth becomes unreasonably expensive. You end up spending all your time (and money) replacing customers instead of scaling.
They're two ways of saying the same thing, but they lead to different conversations:
- "Our churn is 10% monthly" = sounds like a problem
- "Our retention is 90% monthly" = sounds... slightly less alarming?
Both are true. Both are 90% annual churn. But retention sounds better, which is why it's popular in pitch decks.
How to Actually Measure Both
Simple Churn/Retention
The most straightforward approach:
Churn = (Customers Lost This Month / Customers at Start of Month) x 100
Retention = 100 - Churn
This works for month-to-month comparisons and is easy to explain to stakeholders. It's similar to how bounce rate works—you're calculating the percentage of users who don't continue.
Cohort-Based Retention
This is more sophisticated and more useful for product teams.
Cohort-based retention tracks customers by when they joined, then measures what percentage stick around after 1 day, 7 days, 30 days, 90 days, etc.
Why? Because new customers have different behavior than existing customers. Your 3-month retention on customers acquired in January looks different from customers acquired in June.
Example cohort retention table:
| Cohort | Day 1 | Day 7 | Day 30 | Day 90 |
|---|---|---|---|---|
| January | 95% | 85% | 75% | 60% |
| February | 92% | 82% | 72% | 58% |
| March | 94% | 84% | 74% | 62% |
| April | 93% | 83% | 73% | 61% |
This tells you way more than "our retention is 75%". You can see:
- Day 1 retention is stable (approximately 93-95%) - good onboarding
- Day 30 retention is stable (approximately 72-75%) - decent product-market fit
- Day 90 retention is slowly improving - your improvements are working
Rolling Window Retention
Another approach for subscription businesses:
Track the percentage of customers from 30 days ago who are still active today. This gives you a real-time signal of retention health without waiting for month-end.
If you had 100 customers 30 days ago and 90 are still paying, you're at 90% rolling 30-day retention.
What is a Good Churn or Retention Rate?
This varies wildly by industry and business model.
B2B SaaS
- Acceptable monthly churn: 3-5%
- Good monthly churn: 1-3%
- Great monthly churn: less than 1%
Annual churn is where it gets scary. 5% monthly churn = approximately 46% annual churn. 3% monthly = approximately 30% annual. 1% monthly = approximately 11% annual.
Most healthy B2B SaaS companies target monthly churn under 2%.
B2C / Free-to-Paid
- Acceptable monthly churn: 5-10%
- Good monthly churn: 2-5%
- Great monthly churn: less than 2%
Why higher? Consumer product churn is inherently higher. People are more willing to try, and more willing to cancel. That's normal.
Freemium Models
- Acceptable conversion + churn: Varies wildly
- But: If you're losing users faster than you're acquiring them, you have a problem
The point: Your benchmark depends on your model. But don't get comfortable with high churn just because "that's how this business works". Stripe didn't get to their payment dominance by accepting industry-standard churn rates.
Why Both Metrics Matter for Different Teams
Product Teams
Care about retention. It's the signal that users find value. Churn feels like failure. Retention sounds like success.
But here's the trap: You can have 90% retention and still have a dying business if your churn offsets your acquisition. You need to understand both numbers together.
Finance Teams
Care about churn. It's the denominator in your CAC payback period, your LTV calculations, your growth projections. Everything financial depends on churn.
A finance person saying "our monthly churn improved from 5% to 4%" is saying "we just made our business 25% more valuable".
Executive Leadership
Should care about both, but often only focus on churn. It's the number that determines whether you're viable long-term.
But they also need to understand retention trends, because retention signals product-market fit, which is what investors and boards really care about.
How to Track Both in Rybbit
Rybbit makes tracking churn and retention straightforward because it gives you both user-level data and event tracking. Here's how to use it effectively:
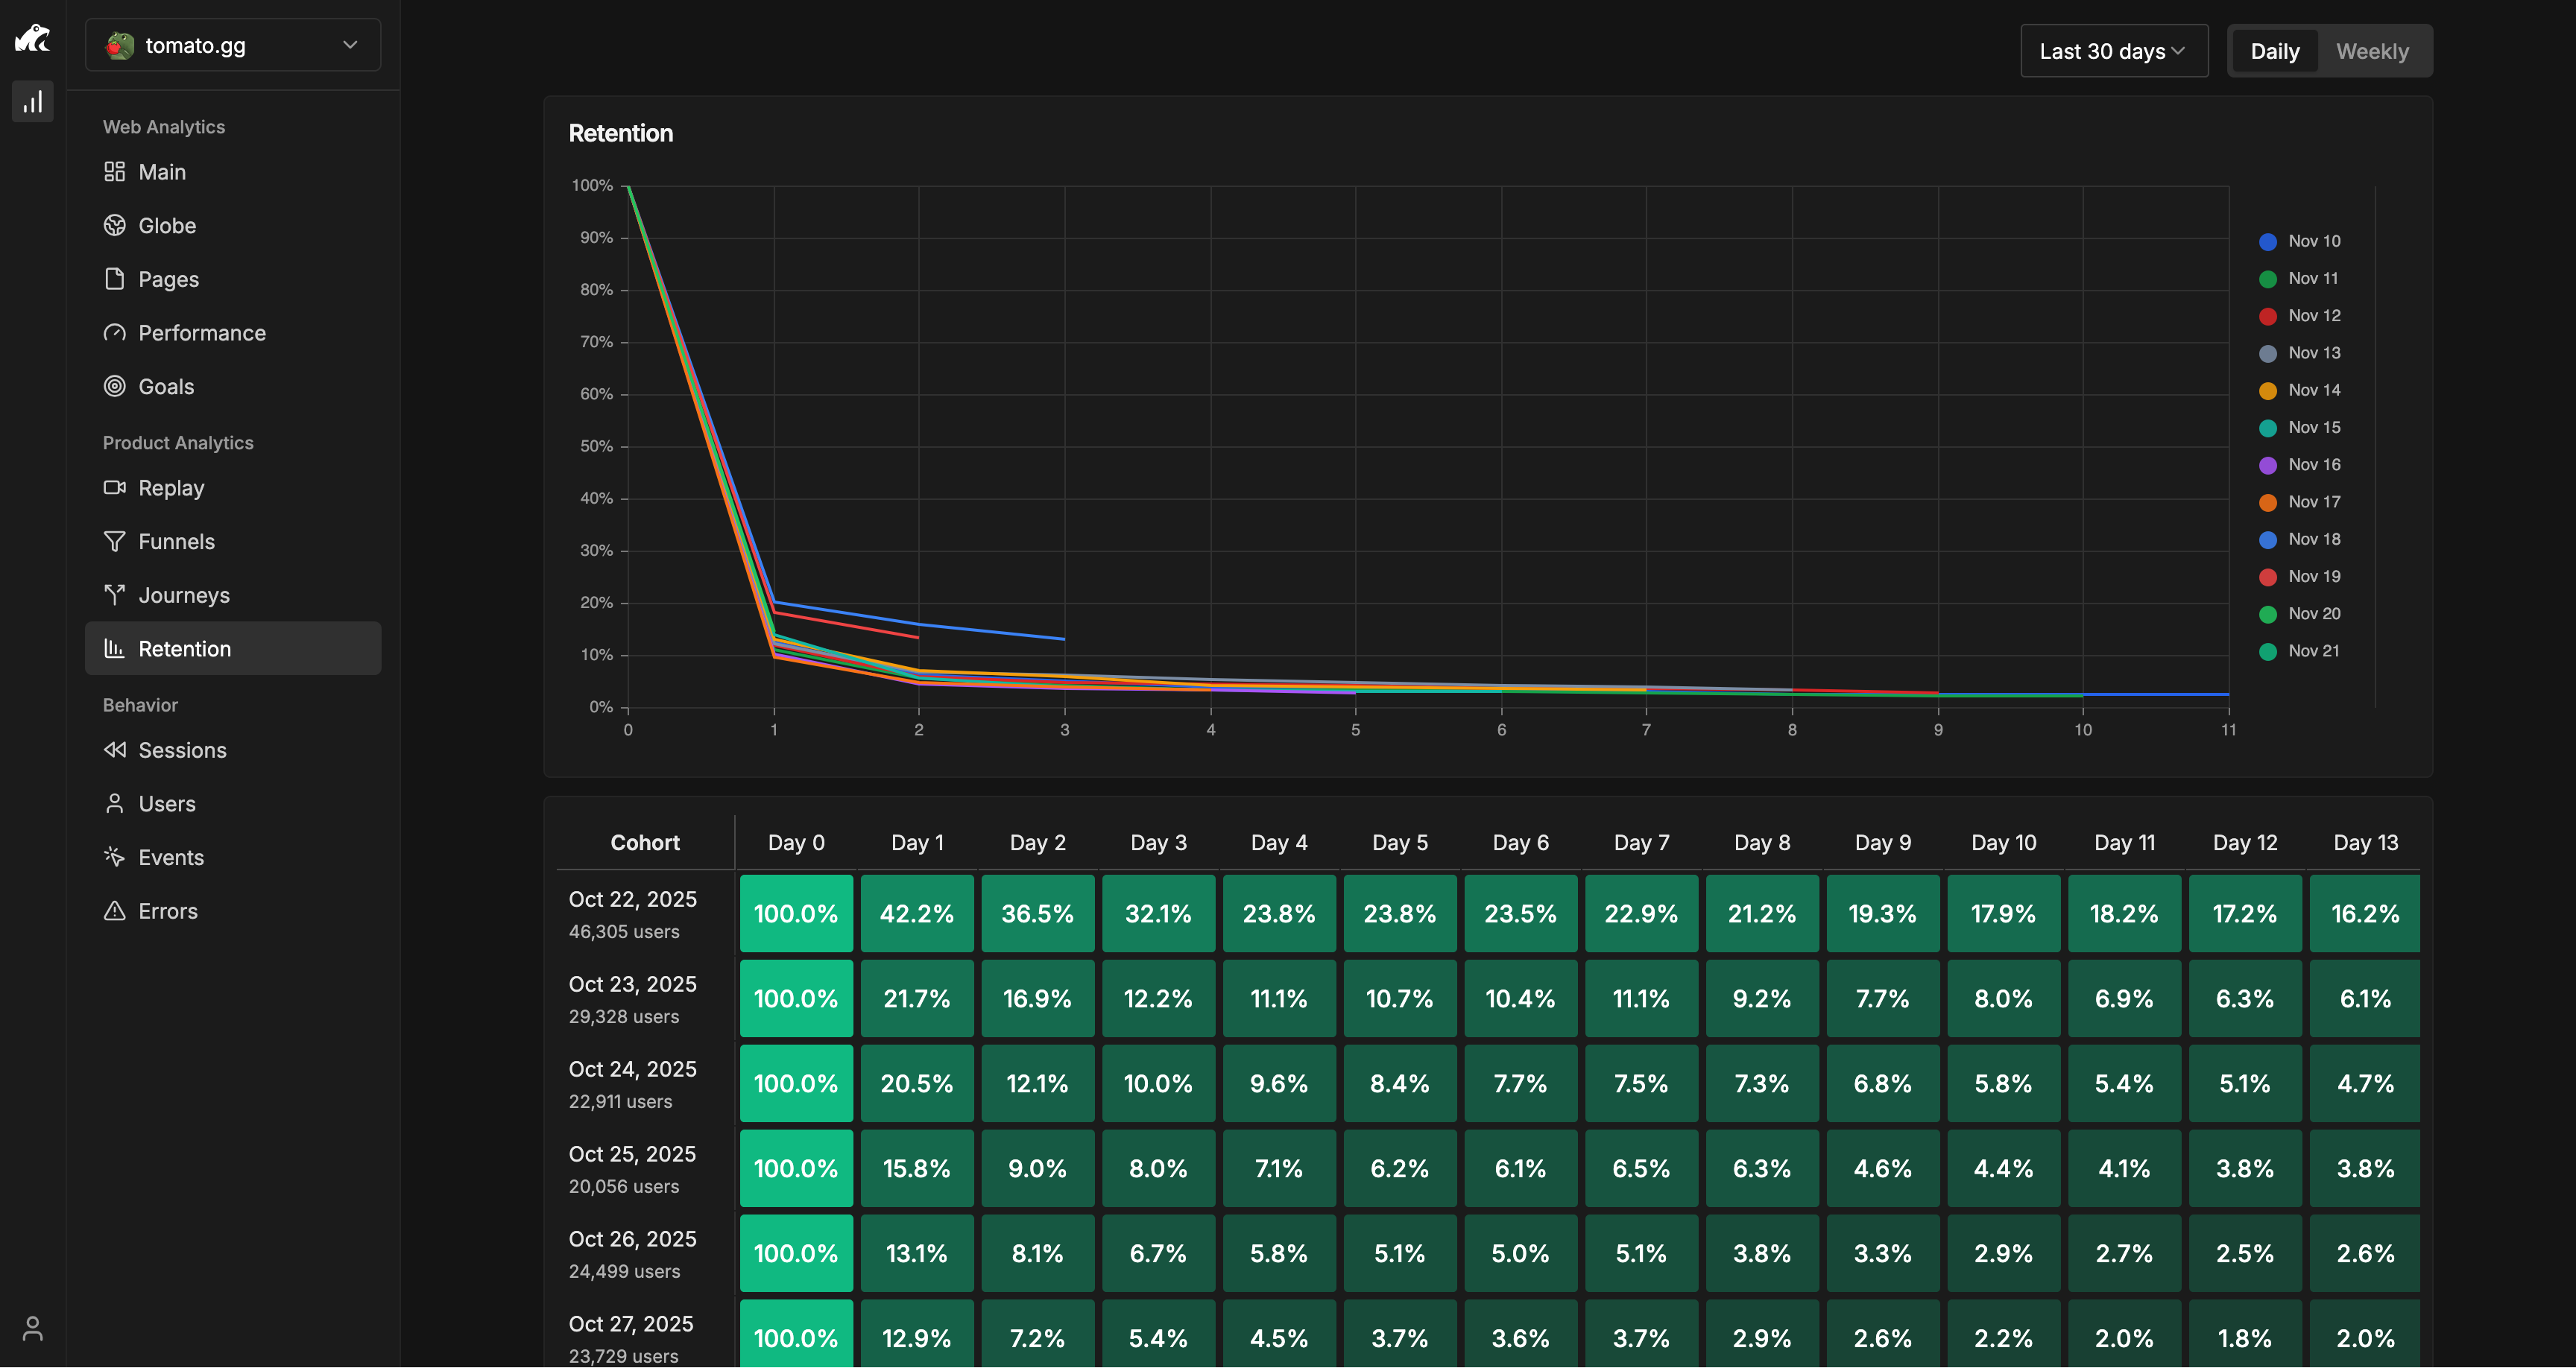
The Retention dashboard in Rybbit shows you cohort retention rates over time, making it easy to see patterns in which users stick around and which ones churn.
Setting Up Churn Tracking
-
Define your churn event: First, create a custom event that fires when a customer churns. This might be:
- Subscription cancellation
- Account deletion
- Failed payment after retry
- Days without login (for free products)
-
Track cohorts of customers: Use Rybbit's cohort analysis to group customers by signup month, then measure what percentage churned each month.
-
Calculate churn from your dashboard: In Rybbit, navigate to the Events tab and filter by your churn event. Divide the count of churned users by your starting user count for that month to get your monthly churn rate.
Measuring Retention with Rybbit
The more powerful use case is building retention curves:
-
Create user cohorts by signup date: In Rybbit, go to the Users tab and filter by "First Visit Date" to create cohorts of users who signed up in specific time periods.
-
Track engagement events: For each cohort, monitor which events they trigger over time. Create custom events that signal retention such as:
- Product signup or first login
- First feature usage
- Key actions that indicate active usage
- Subscription renewal
- Support interaction
-
Analyze retention trends: Use Rybbit's Users tab to see:
- How many users from each cohort are still active this week/month
- Which cohorts have better retention than others
- Whether new changes improved retention
-
Compare cohorts: Look at your retention curves month-over-month to see if retention is improving or declining across different user groups.
Rybbit Dashboard Usage
Here's how to use Rybbit's specific features:
Users Tab:
- Filter by first visit date to see cohorts
- Monitor "Total Sessions" and "Pages Viewed" to see if cohort engagement is changing
- Compare metrics between cohorts to spot retention improvements
Events Tab:
- Filter by your custom retention/churn events
- See conversion rates for each milestone event
- Track how many users from each cohort hit each milestone
Sessions Tab:
- Analyze session duration trends for different cohorts
- See if users are getting more engaged (longer sessions) or less (shorter sessions)
- Identify behavior changes that correlate with churn
Filtering & Segmentation:
- Use custom date ranges to compare cohorts
- Filter by properties like plan type, signup method, or geography to see which segments have better retention
- Create segments like "high-value customers" and track their retention separately
Real Example: Tracking Key Retention Milestones
For a product like a project management tool, you would track:
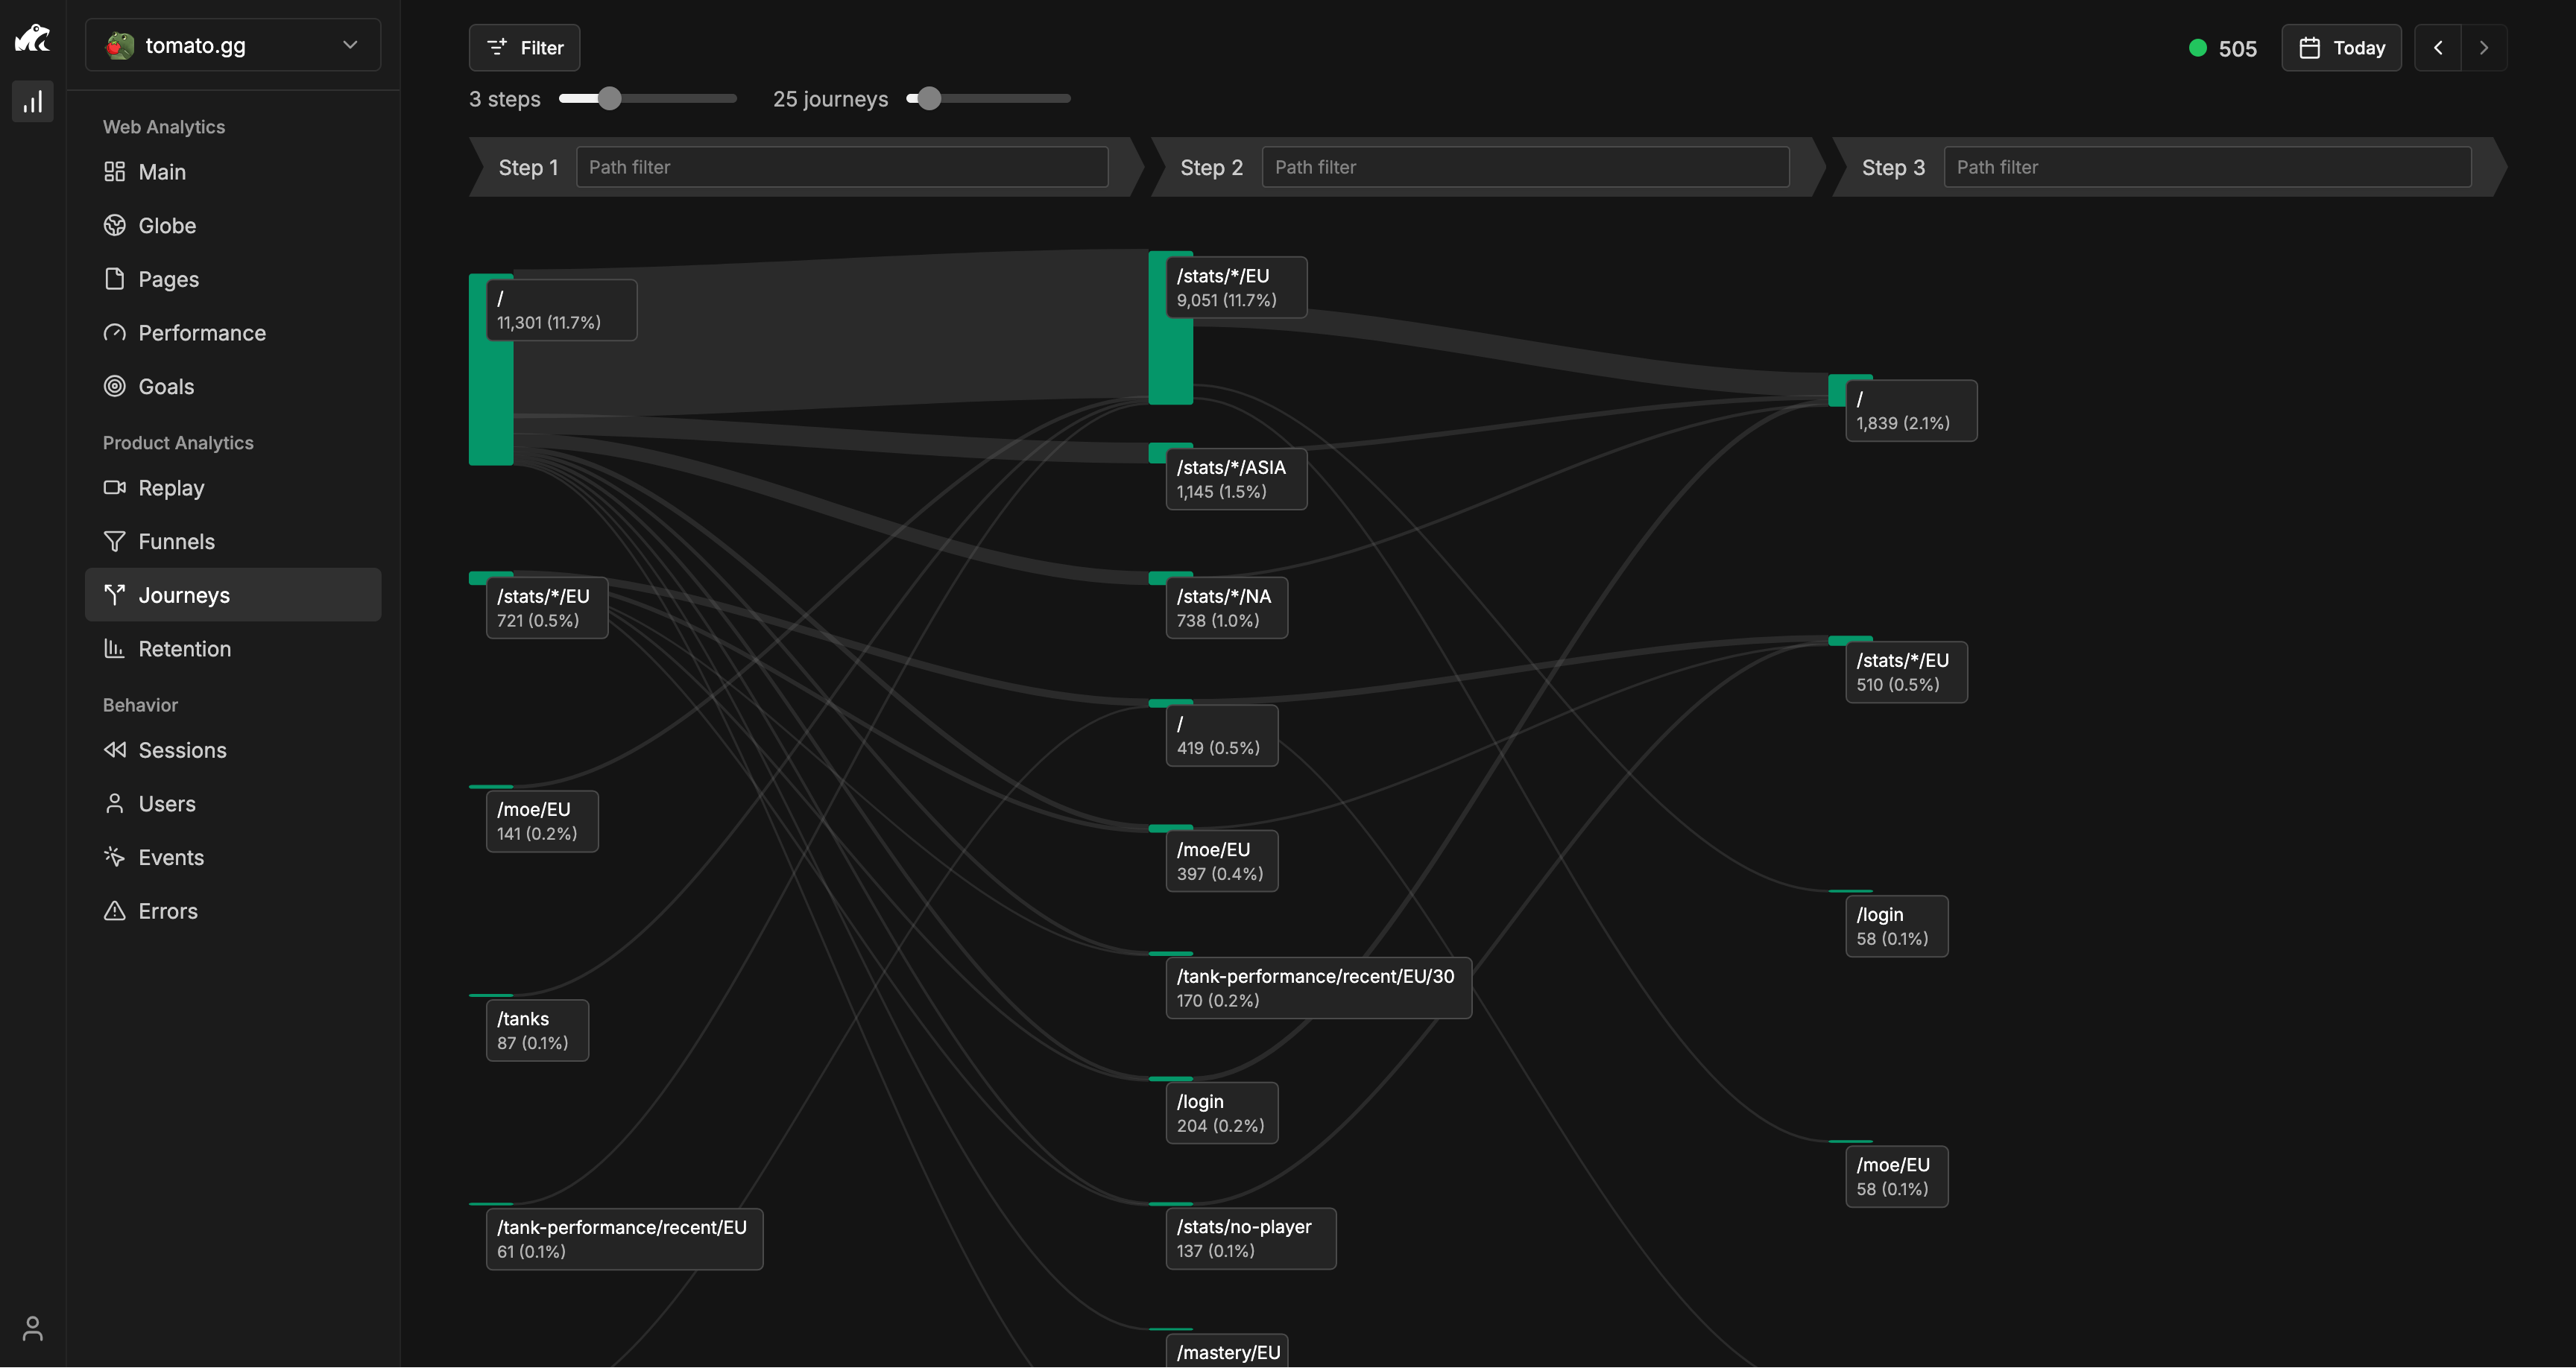
Use the journey dashboard to see the typical paths users take through your product, revealing which sequences lead to long-term retention.
Early engagement (Week 1):
- User account creation
- First meaningful action (e.g., creating first project)
- Day 7 return visit
Mid-term engagement (Month 1):
- Day 30 activity level
- Feature adoption patterns
- Plan upgrade decisions
Long-term tracking (Month 3+):
- Plan upgrades or downgrades
- Churn events (inactivity, cancellation)
- Engagement levels over time
In your Rybbit dashboard, you can track:
- What percentage of users hit your key retention milestones
- Upgrade rates for different user cohorts
- Patterns in which users retain versus churn
- Whether improvements over time are moving the needle
Key Rybbit Features for Churn/Retention
Cohort Analysis: Group users by signup date and track their metrics over time. This is essential for retention curves.
Custom Events: Define exactly what "retention" means for your business and track it specifically.
Filtering: Segment by plan type, signup source, geography, etc. to find which users are at higher churn risk.
Date Range Comparison: Compare this month's cohorts to last month's to see if you're improving retention.
Users Tab Metrics: Track total sessions, pages viewed, and activity frequency for each cohort.
The key insight: Retention isn't a single number. It's a curve that changes over time. By tracking your cohorts in Rybbit and monitoring their engagement events, you can see exactly when and why users churn - and whether your retention improvements are working.
How to Reduce Churn and Increase Retention
Knowing your churn rate is only half the battle. The real value comes from improving it. Here are practical strategies that actually work:
Use Rybbit's funnel analysis to track where users drop off in your onboarding flow and identify optimization opportunities.
1. Optimize Your Onboarding
Most churn happens in the first 30 days. Users who successfully experience value during onboarding are significantly more likely to stick around.
What to do:
- Create a clear path to first value. Don't overwhelm new users with features. Guide them to the one action that makes your product meaningful.
- Track onboarding milestones in Rybbit: "Completed profile setup", "Imported first data", "Created first project"
- Measure time-to-value. How long until a new user takes their first meaningful action? Shorter is better.
- A/B test your onboarding. Try different flows and measure which cohort has better day 7 and day 30 retention.
The key is that users who successfully get value from your product become users who experienced success. They're more likely to remain active than users who just signed up.
2. Identify and Segment At-Risk Users
Not all customers are equal. Some are high-value and worth saving. Others are low-engagement and might not be a good fit.
What to do:
- Use Rybbit to identify users with declining engagement: fewer logins, fewer features used, shorter sessions
- Create segments like "power users", "casual users", and "at-risk users"
- Set up alerts for behavioral changes. If a previously active user goes silent for a week, that's a warning sign.
- Target at-risk segments with intervention: email outreach, feature guidance, support check-in
Real example: If you notice that users in a specific industry vertical churn at 2x the rate of others, that's a signal. Either your product doesn't fit that vertical, or they need different onboarding/support.
3. Gather Qualitative Feedback
Data shows you that users are churning. Talking to them shows you why.
What to do:
- When a user cancels, ask why. Offer a discount or feature request capture. Most importantly, listen.
- For highly engaged users, ask what's working. Double down on that.
- Run surveys or interviews with long-term users to understand what retention is built on
- Share churn feedback with your product team. "We're losing customers because feature X is broken" is more actionable than "monthly churn is 5%"
Real example: You might discover that users churn because they don't know about a feature that would solve their problem. That's a messaging problem, not a product problem. Cheap to fix.
4. Focus on Core Value, Not Vanity Features
Building more features doesn't improve retention. Building the right features does.
What to do:
- Use Rybbit to track which features are actually used by retained users
- Compare feature usage between users who churned vs. users who stayed. What's the difference?
- Ruthlessly deprioritize features that don't correlate with retention
- Invest heavily in the features that retained users depend on
Real example: Project management tools often have many features, but the most engaged users typically focus on and rely on a smaller core set of essential features. Focus on making those core features excellent.
5. Improve Customer Support Response Time
Users who get help quickly stick around. Users who wait days for support tend to leave.
What to do:
- Track support response time as a metric that correlates with retention
- Measure: Do users who got support within 1 hour have better retention than users who waited 24 hours?
- If response time is slow, that's a retention leak. Fix it.
- Proactive support > reactive. Help users before they ask.
6. Price Correctly
Wrong pricing is an invisible churn driver. Too expensive, and you lose customers. Too cheap, and you attract wrong-fit customers who churn.
What to do:
- Analyze churn by pricing tier. Does one tier have dramatically higher churn?
- If low-tier customers churn fast, they might be wrong-fit. Either improve product fit for them or increase prices to attract higher-commitment customers.
- Offer annual plans. Customers who commit annually are more engaged (they've already paid).
- Make upgrade paths clear. Customers should know how to get more value as their needs grow.
Real example: Pricing tiers often show different churn patterns, with lower-priced plans attracting users with lower commitment levels. Understanding your churn by pricing tier helps inform pricing strategy decisions.
7. Create Network Effects or Switching Costs
The harder it is to leave, the less they churn.
What to do:
- Export is expensive. If a user has invested 6 months of data in your system, switching costs are high.
- Integrations matter. If your tool integrates with the other tools they use, it becomes essential infrastructure.
- Community. Users with friends/teammates using your product stick around longer.
- Track engagement with your ecosystem, not just your product.
Real example: Tools that facilitate team collaboration often benefit from network effects. Once teams coordinate around a single platform, switching becomes difficult. Your product doesn't need to do everything - it just needs to be essential to the user's workflow.
8. Monetize Engagement, Not Users
Bad: Charge per user, then lock users into plans they don't use. They resent being charged and they churn.
Better: Charge based on usage or value delivered. Users see ROI. They stay.
What to do:
- Structure pricing around value metrics (projects, reports, API calls) not seats
- Track which pricing model correlates with retention for your business
- Give users ways to control their costs. If they see their bill shrinking, great. If it's growing for unclear reasons, they'll leave.
9. Build a Feedback Loop
Retention improvements compound. Each fix should feed into the next.
What to do:
- Set a baseline churn metric and commit to improving it by 1% per quarter
- After each change, measure impact with Rybbit. Did cohort retention improve?
- Share results with the team. "We improved onboarding and day 7 retention went from 65% to 72%"
- Make retention a company metric, not just a product metric. Marketing, sales, support all influence retention.
Real example: A company that commits to "reduce churn from 5% to 3% annually" will make different product decisions than a company that ignores churn. The target creates accountability.
The Retention Funnel
Think of retention like a funnel:
- Day 1: Did they experience value? (Onboarding)
- Day 7: Did they come back? (Habit formation)
- Day 30: Are they using core features? (Product fit)
- Day 90: Are they engaged enough to upgrade/advocate? (Expansion)
Each stage has different failure points.
- If you have 50% day 1 retention, fix onboarding
- If you have 90% day 1 but 40% day 30, your product doesn't deliver value
- If you have 80% day 30 but 60% day 90, you're losing long-term engagement
Use Rybbit to measure each stage and fix the biggest leak first.
The Bottom Line
Churn rate and retention rate are two ways of measuring the same thing. Neither is "more important" - but they serve different purposes:
- Use churn when you want to focus on the problem (we're losing customers)
- Use retention when you want to focus on the solution (we're keeping customers)
- Track both to understand your business health
In practice:
- Monitor your monthly churn to ensure sustainability
- Build cohort retention curves to understand product-market fit
- Use both to set company OKRs (e.g., "reduce monthly churn from 5% to 3%")
- Analyze retention by segment - your high-value customers might have different retention than low-value ones
- Correlate retention changes with product changes - did that new feature move the needle?
- Implement improvements systematically: onboarding first, then feature focus, then support
- Measure everything. If you're not tracking retention by segment and by cohort, you're flying blind
Remember: A business doesn't scale by acquisition alone. It scales by finding the right customers, delivering value, and keeping them. That's retention.
Everything else is just trying to fix the leak in your bucket while you're pouring water in the top.
Related Reading:
- Behavior Analytics - Sessions Tab
- Behavior Analytics - Users Tab
- Behavior Analytics - Events Tab
- Behavior Analytics - Errors Tab
- Product Analytics - Retention Guide
- Track Custom Events
- Blog: Bounce Rate Guide
- Blog: Website Traffic Drop Analysis
- Blog: E-commerce Analytics
- Blog: Sales Funnel Guide
- Blog: Web Analytics Guide