What is a Sales Funnel and How to Measure It with Rybbit Analytics
Learn what a sales funnel is, why it matters for your business, and how to measure and optimize your funnel using Rybbit Analytics.
What is a Sales Funnel and How to Measure It with Rybbit Analytics
Your website gets thousands of visitors every month. But how many actually become customers?
That's the sales funnel question. It's not just about traffic—it's about results. Understanding this is a fundamental aspect of web analytics.
A sales funnel is the journey your customers take from first learning about you to making a purchase (or taking whatever action matters most for your business). But most companies don't actually understand their funnels. They see visitor numbers, but they can't see the actual conversion process.
This is where analytics comes in.
In this guide, we'll explain what a sales funnel is, why it matters for your business, and how to measure and optimize yours using Rybbit Analytics.
What is a Sales Funnel?
A sales funnel is the path your potential customers follow as they move from awareness of your product toward making a purchase decision. Think of it like a literal funnel: wide at the top, narrow at the bottom.
At the top, you have a large number of people who are just learning about you. As they move down the funnel, some stay engaged while others drop off. By the time they reach the bottom, you're left with customers who actually complete the purchase.
The Stages of a Sales Funnel
While specific stages vary by business type, most sales funnels follow this general structure:
Awareness Stage People learn that your product or service exists. They discover you through search engines, social media, ads, word of mouth, or other channels. At this stage, they don't know much about you—they just know you're an option.
Consideration Stage People are now aware of you and are thinking about whether your solution might work for them. They're comparing you to alternatives, learning more about your approach, and deciding if you're worth their time.
Decision Stage People are ready to take action. They might add items to a cart, request a demo, contact your sales team, or complete a purchase. This is where awareness and interest convert into tangible action.
Retention Stage (for repeat customers) After purchase, the funnel doesn't end. Successful companies continue serving customers through onboarding, support, and upsell opportunities.
Understanding Funnel Drop-off
Here's the key insight: not everyone who enters your funnel completes it. In fact, most don't. This is related to bounce rate, which measures visitors who leave without taking action.
For an e-commerce site, maybe 1,000 people view a product page. Of those, 300 add the product to their cart (70% drop off). Of those 300, 150 actually complete checkout (50% drop off). Your overall conversion rate from product view to purchase? Just 15%.
This drop-off isn't a bug—it's normal. But it's also an opportunity. Because if you can improve each stage, you dramatically increase your results.
If you could increase your checkout completion rate from 50% to 60%, for example, you'd get 30 more customers from the same 300 people. If each customer is worth $100, that's $3,000 in additional revenue. That's meaningful impact.
But here's the problem: most companies don't see this data clearly. They see page views. They see sessions. But they don't see the funnel.
Why Sales Funnels Matter
Understanding your sales funnel isn't just about optimization—it directly impacts your bottom line. Here's why it matters:
Your funnel reveals where the real opportunities are. If 10,000 people visit your site but only 100 become customers, that 1% conversion rate tells you where to focus. But knowing that 8,000 people never even make it to the product page tells you something more important—your awareness to consideration stage is the problem.
You can quantify the impact of changes. After you optimize something, the funnel tells you if it worked. Did adding more images to your product page increase conversion rates? Did simplifying your checkout form reduce abandonment? The data will tell you.
Funnels help you understand user behavior at scale. You can see patterns that individual sessions don't reveal. You can see which traffic sources produce better-converting customers. You can see if mobile users drop off more than desktop users. This pattern recognition is where real insights come from.
You can prioritize your optimization efforts. Rather than guessing about what to improve, the funnel shows you exactly where to focus. If 50% of users drop off at the shipping information step, that's your #1 priority. Not a guess. Data.
The funnel is your most important metric for measuring business growth. Revenue doesn't come from traffic—it comes from conversion. Your funnel is the bridge between traffic and revenue.
The Key Metrics in Your Funnel
To understand your funnel, you need to understand these metrics:
Users at Each Step How many people reach each stage of your funnel? This number will typically decrease as you move down the funnel. Knowing the absolute numbers helps you understand the scale of opportunity at each stage.
Conversion Rate What percentage of people successfully move from one step to the next? If 1,000 people start your funnel and 200 complete step 1, your step 1 conversion rate is 20%. This metric shows you the efficiency of each stage.
Drop-off Rate The inverse of conversion rate. If 20% convert, 80% drop off. Understanding drop-off rates shows you where you're losing the most potential customers.
Overall Conversion Rate What percentage of people who enter your funnel actually complete it? If 10,000 people land on your product page and 100 make a purchase, your overall conversion rate is 1%. This is typically your most important funnel metric.
How to Measure Your Sales Funnel with Rybbit Analytics
Understanding your funnel conceptually is important. Measuring it is essential.
Rybbit Analytics provides multiple features to help you understand and optimize your sales funnel:
Setting Up Funnel Tracking
Rybbit's Funnel feature lets you define the steps that matter for your business and see exactly how many users complete each step. You can track:
- Product views → Add to cart → Checkout → Payment completion (e-commerce)
- Landing page → Signup form → Email verification → First login (SaaS)
- Contact form view → Form submission → Sales conversation (B2B services)
For each funnel, Rybbit shows:
- The number of users at each step
- Conversion rates between steps
- Drop-off percentages
- Overall funnel conversion rate
- How performance varies by traffic source and device
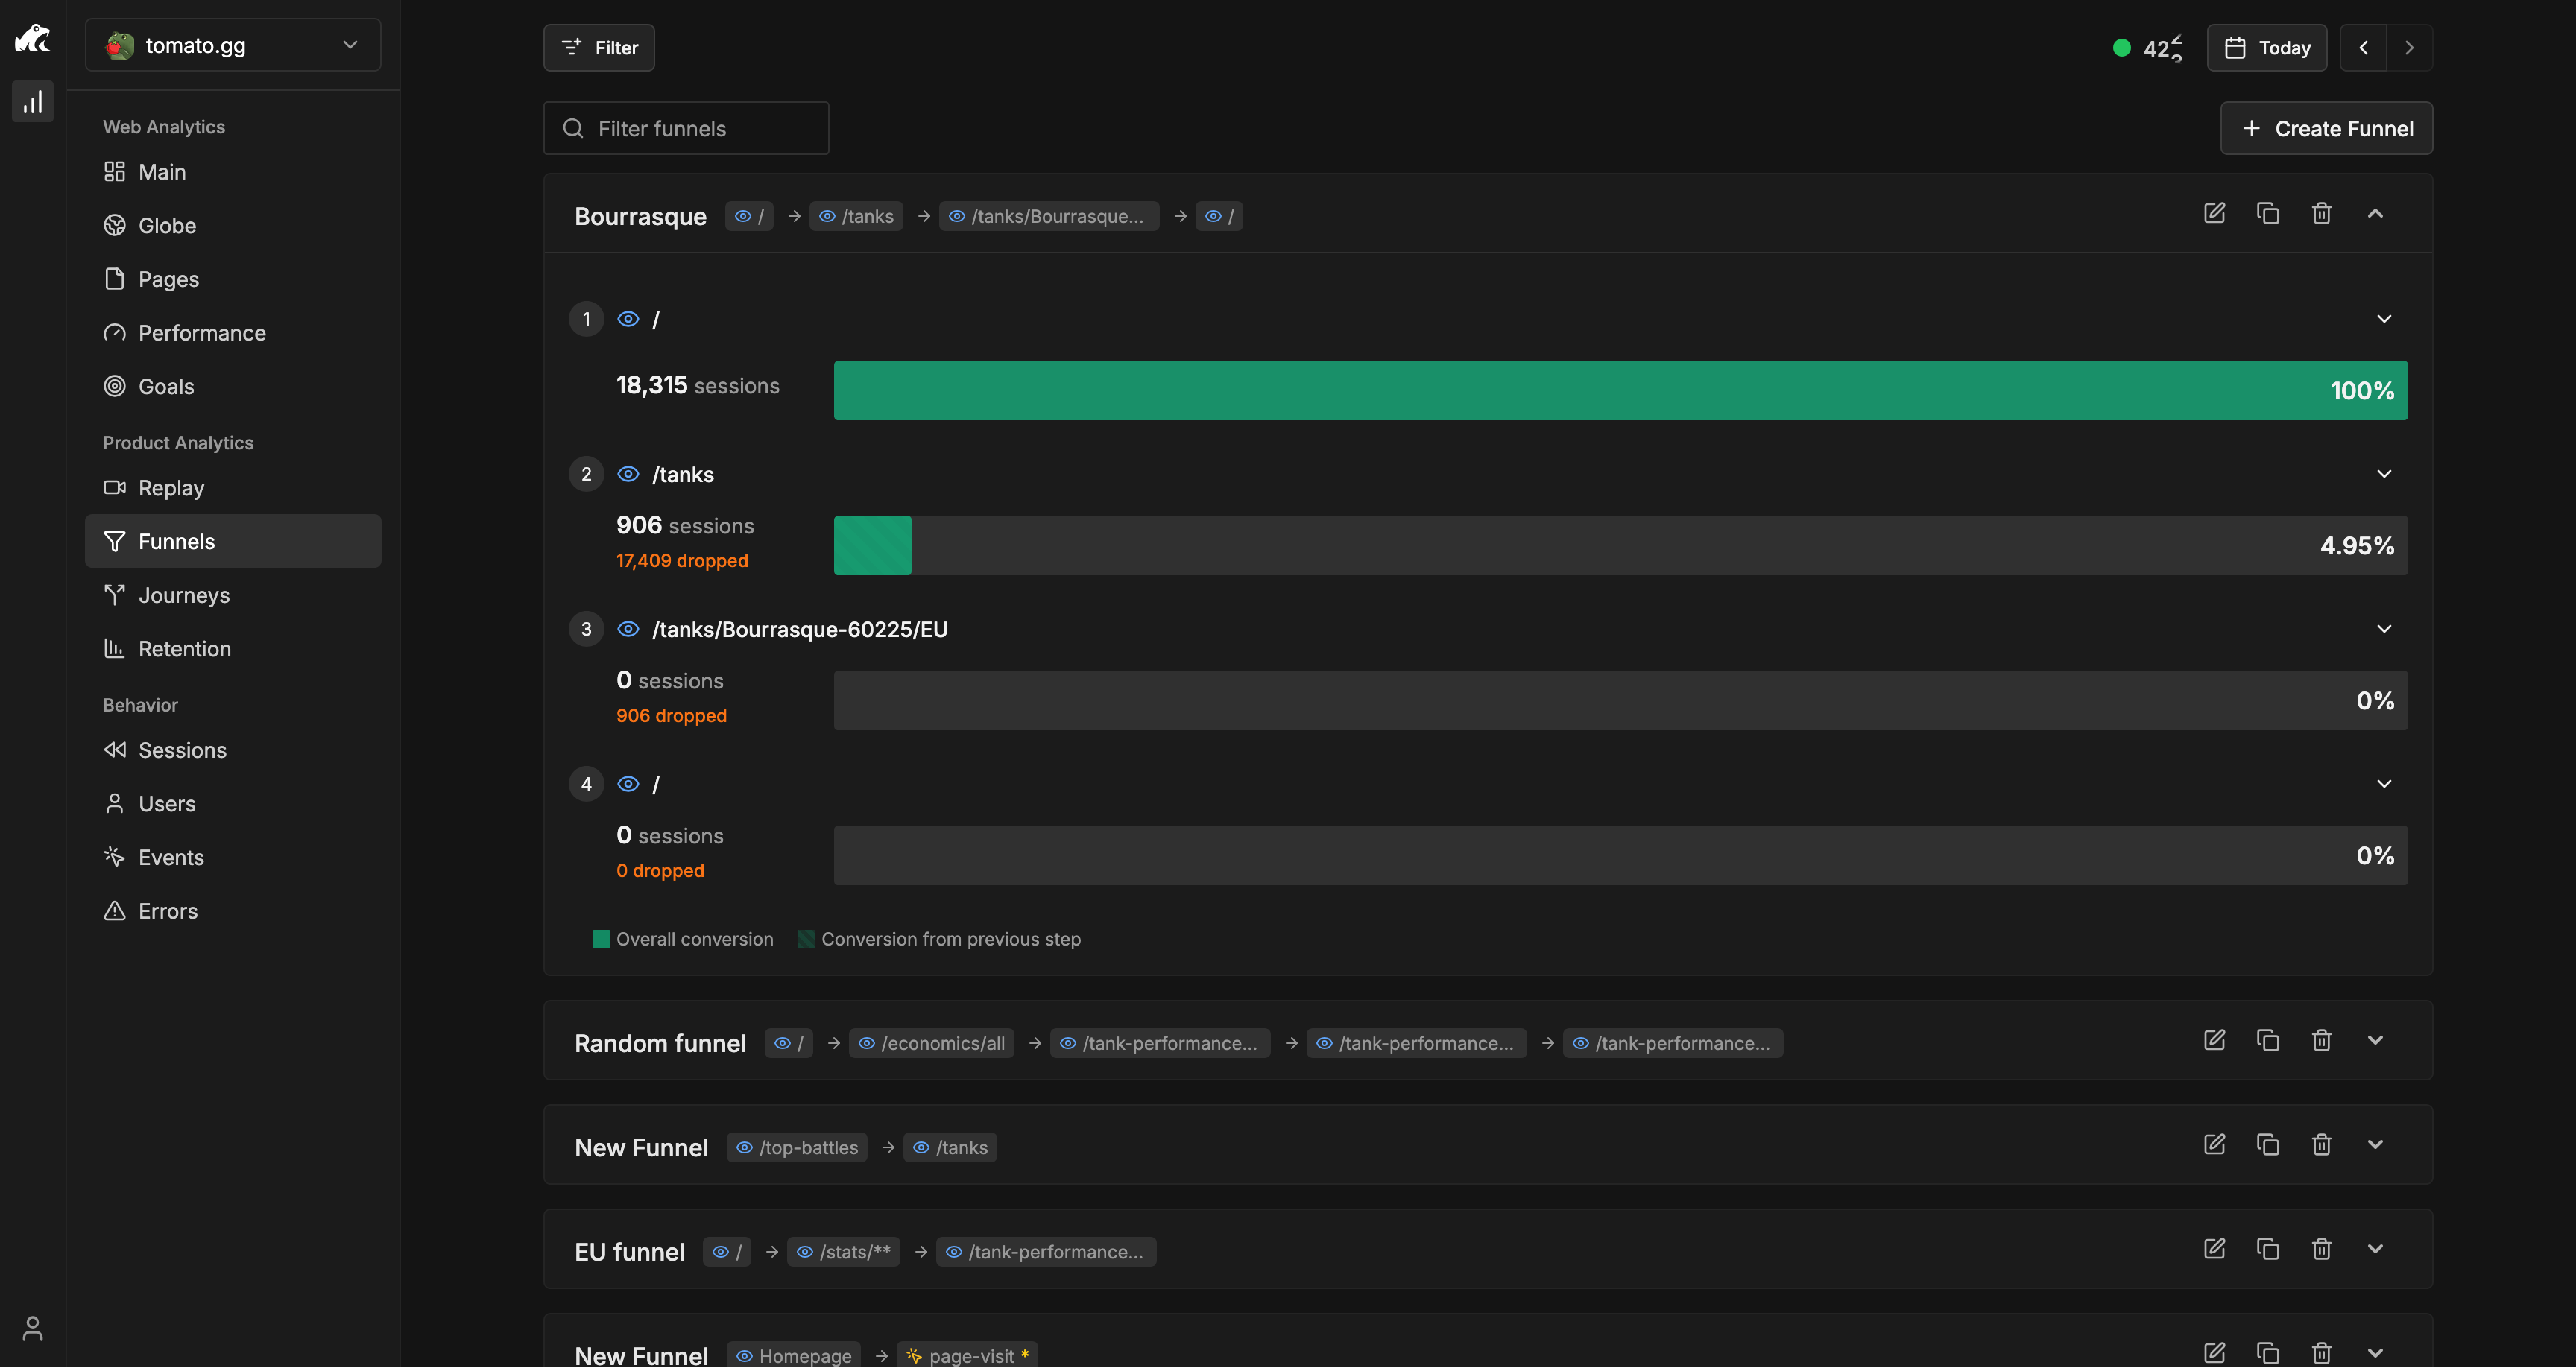
The visual funnel representation makes patterns instantly obvious. When 1,000 users start your funnel but only 50 complete it, you see it at a glance. And you see exactly which step has the biggest drop-off, so you know where to focus your optimization efforts.
Setting Up Conversion Goals
Not everything in your funnel is a multi-step process. Sometimes conversion is a single action: completing a form, reaching a thank-you page, or clicking a button.
Rybbit's Goals feature lets you track these key conversions. You can create goals for:
- Form submissions
- Page visits (like a thank-you page)
- Custom events (like a button click)
For each goal, Rybbit shows:
- How many conversions happened
- What percentage of sessions converted (conversion rate)
- Performance by traffic source
- Performance by device type
- Trend compared to previous period
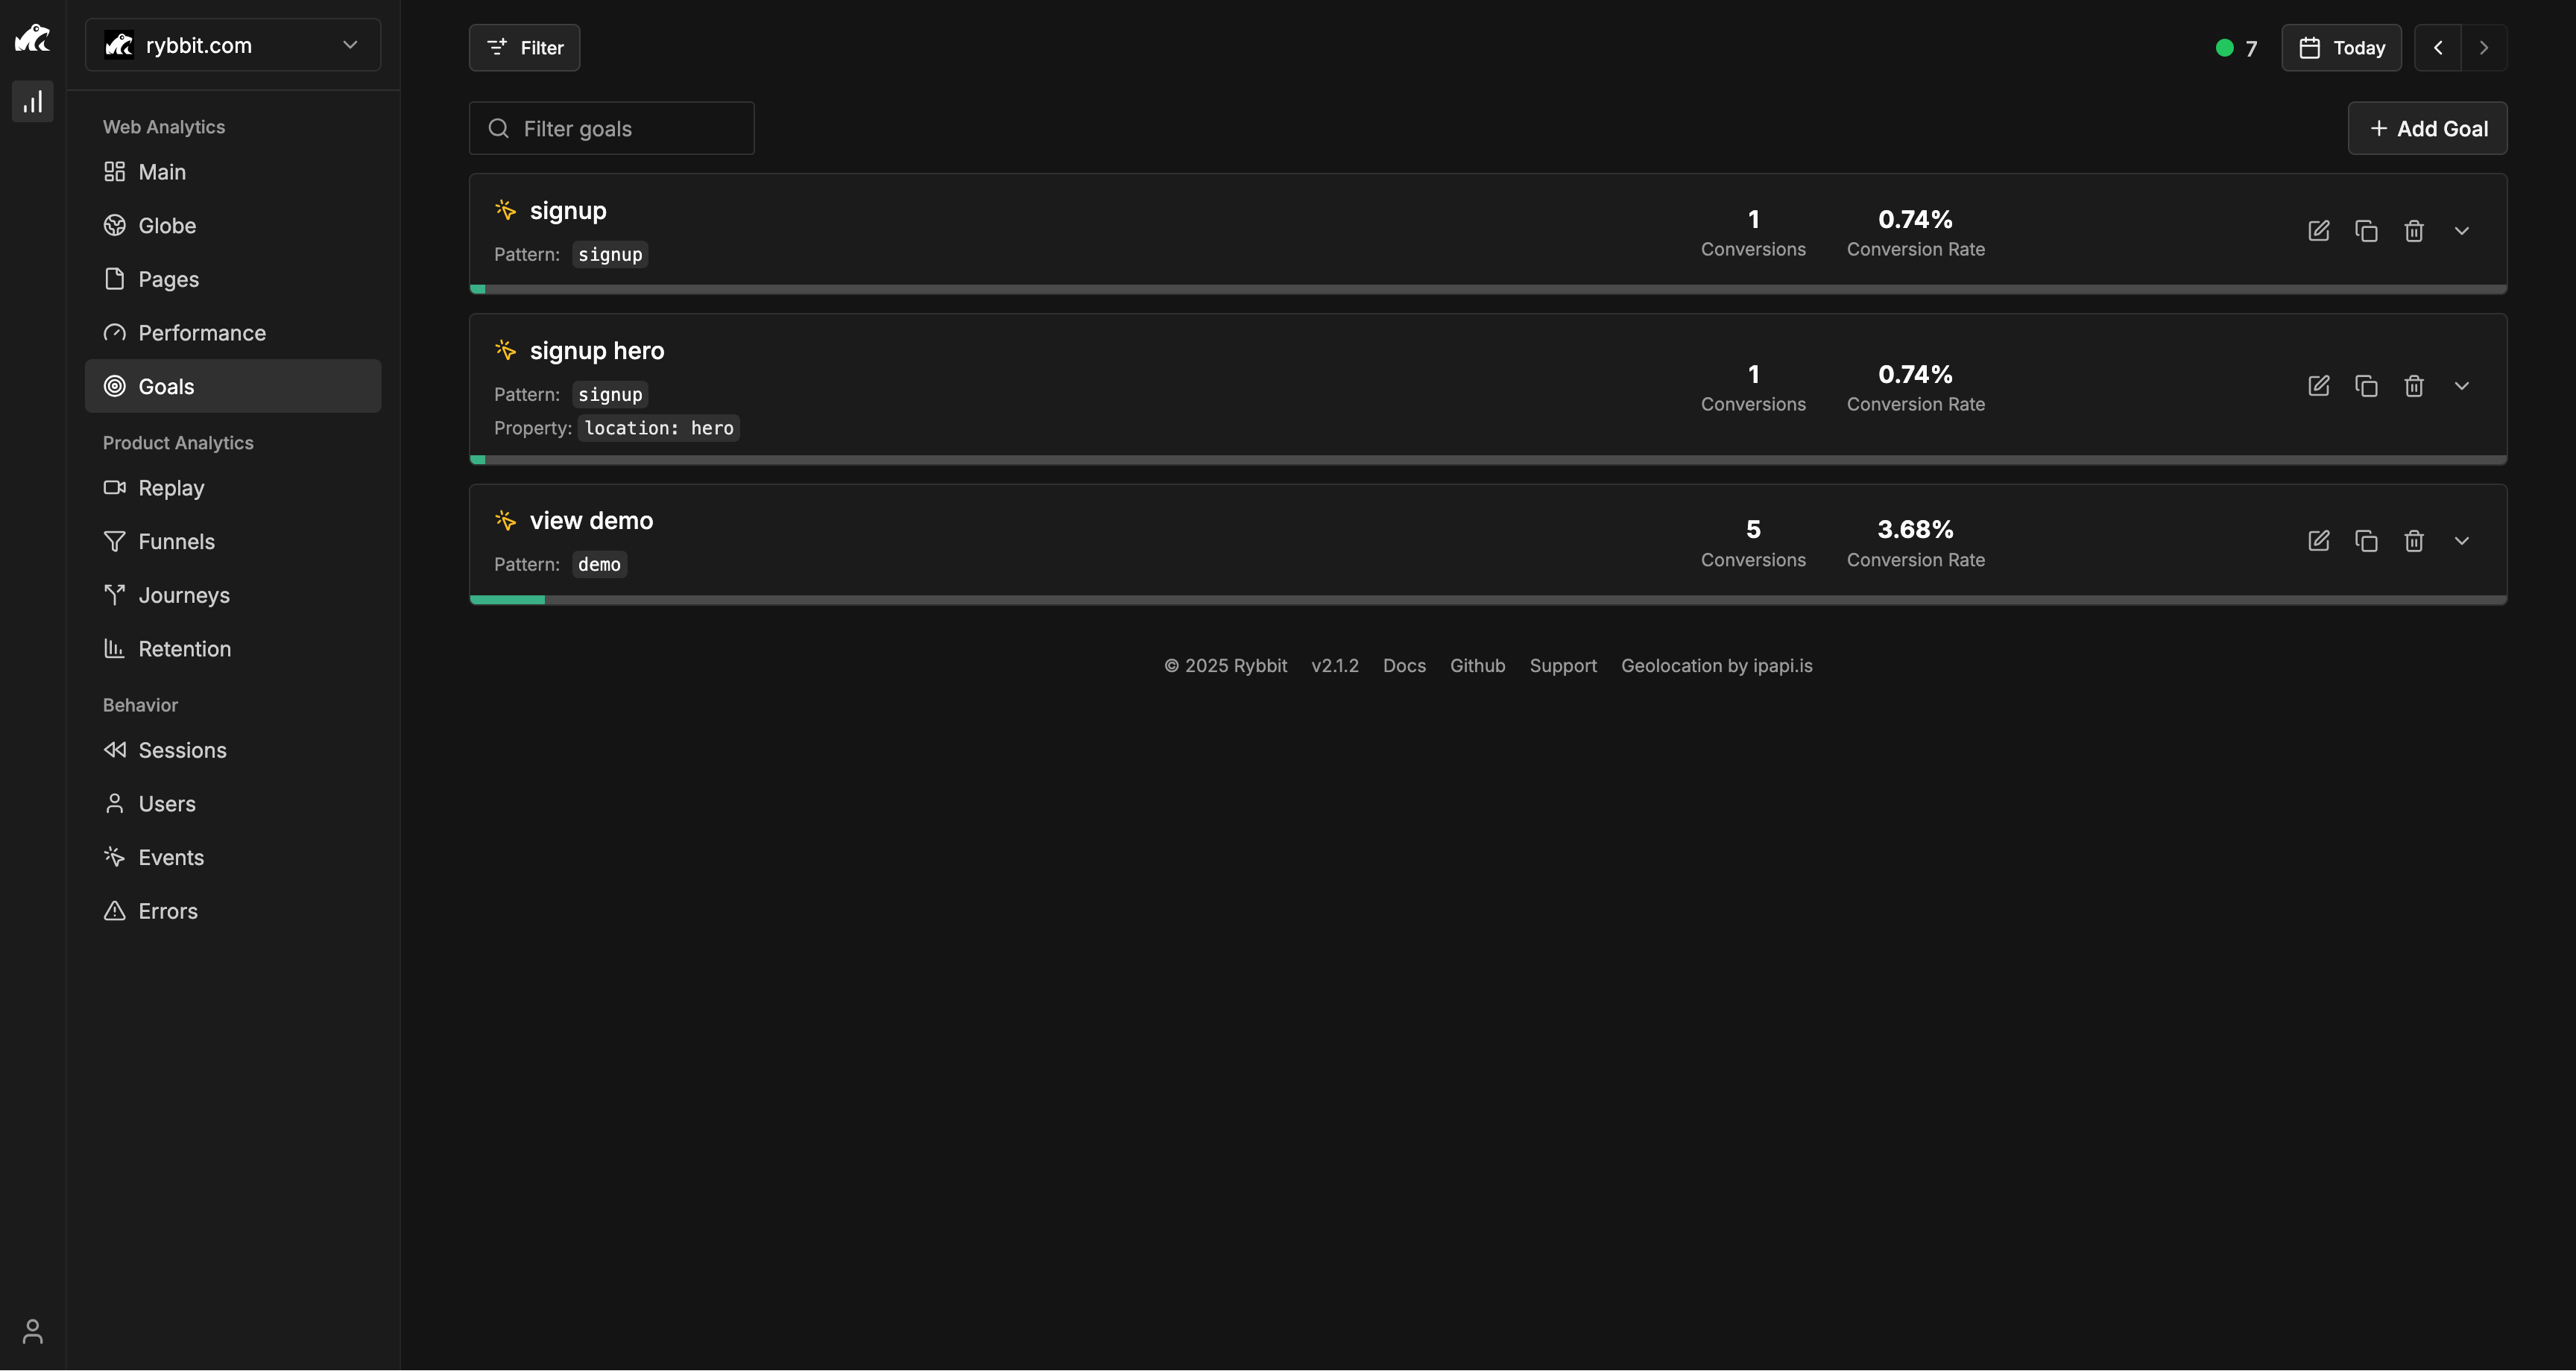
This helps you understand not just the multi-step processes, but also individual conversion actions that matter to your business.
Analyzing Which Pages Drive Results
Your website has many pages. But which ones actually drive conversions?
Rybbit's Pages section shows you the performance of each page on your site: traffic, bounce rate, session duration, and which sources bring traffic to each page.

You can click on any page to see only the traffic and behavior of people who visited that page. This tells you: "If someone visits this page, are they more or less likely to convert than average?"
For funnel analysis, this is powerful. You can see:
- Which product pages drive the most cart additions?
- Which blog posts drive the most newsletter signups?
- Which landing pages have the best conversion rates?
This helps you understand which content and pages are most valuable in your funnel.
Segmenting Your Funnel by Traffic Source
The same user might behave very differently depending on how they discovered you.
Someone coming from organic search to your product page might have stronger purchase intent than someone coming from a random social media ad. Rybbit lets you filter your funnel by traffic source (organic, email, paid ads, social, referral, direct) to understand these differences.

You might discover patterns like: "Organic search traffic converts 2x better than social traffic" or "Email brings fewer visitors but they convert at a higher rate." These insights guide where you invest your marketing budget.
Understanding Device Performance
Mobile and desktop users often behave very differently.
Rybbit lets you filter your funnel by device type (mobile, tablet, desktop) to see if your conversion rates differ across devices.

If you discover that mobile users drop off significantly more at the checkout step, that's a clear priority for optimization. If desktop drives 90% of conversions but mobile drives only 10%, even though they bring similar traffic, you know mobile experience needs work.
Mapping User Journeys
Your "funnel" assumes users follow a specific path. In reality, many don't.
Some users view pages in different orders. Others skip steps. Some visit your site, leave, come back later, and eventually convert.
Rybbit's Journeys feature shows you the actual paths users take through your site before converting.
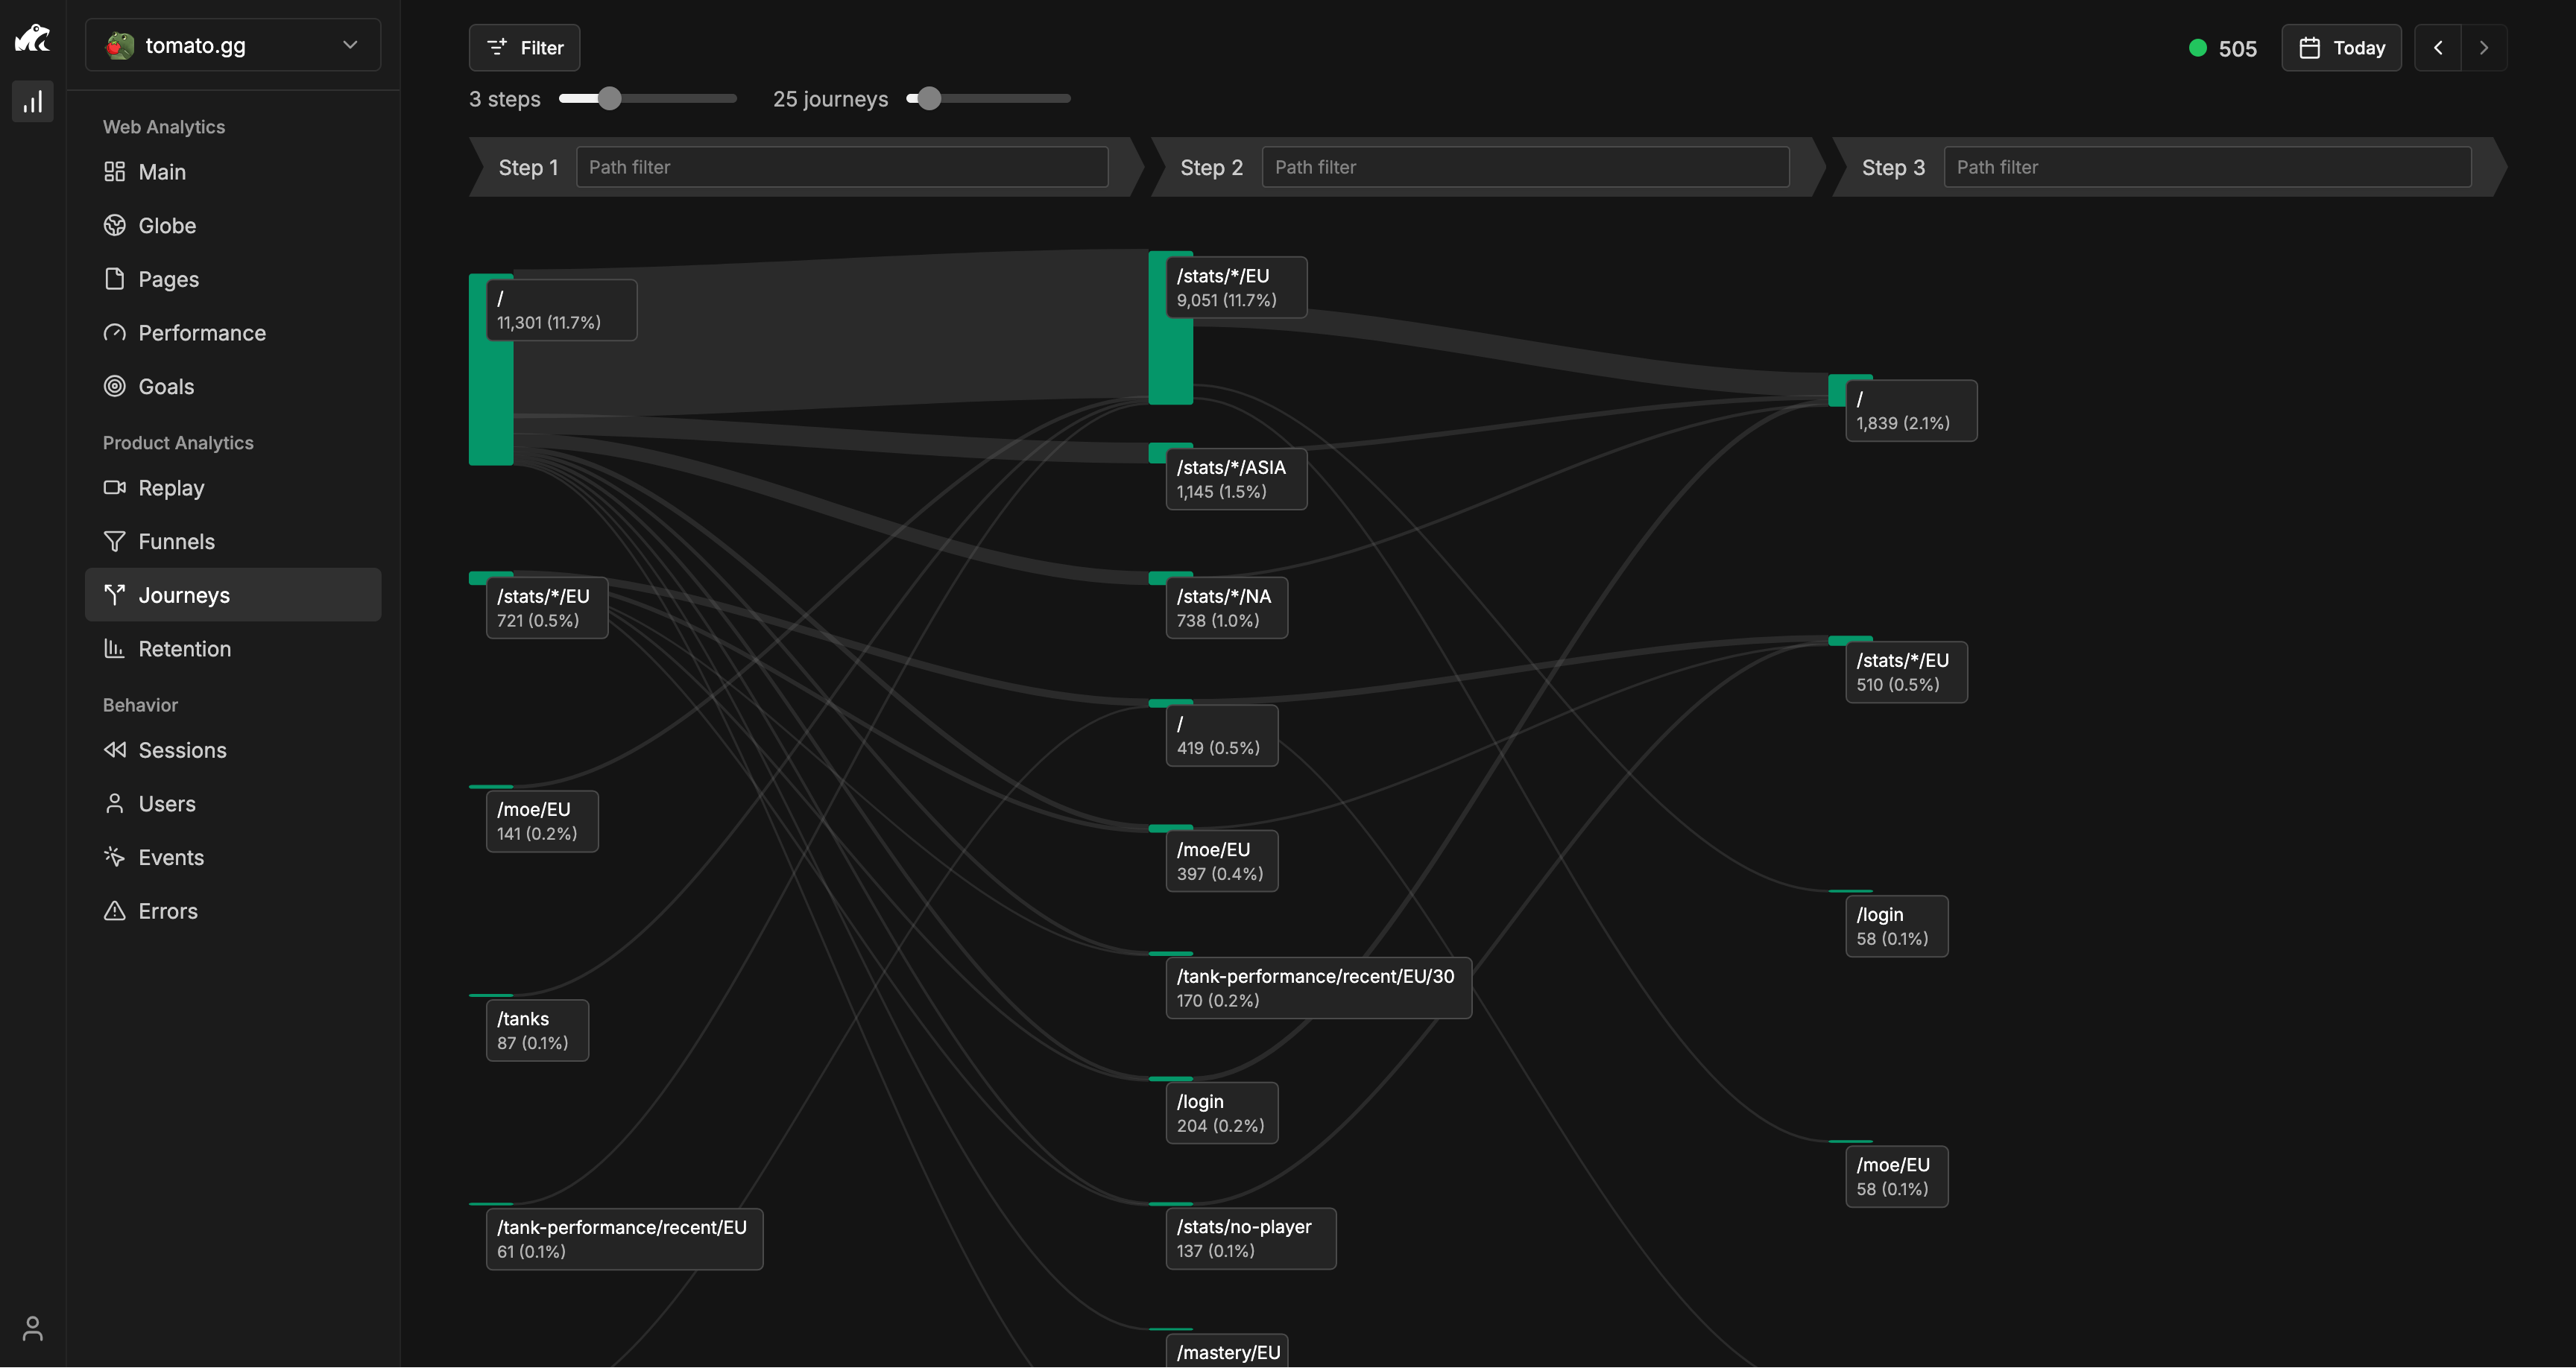
You can work backward from a conversion to see: "What did successful users typically do before converting?" Or forward from an entry point: "Where do users go after they land here?"
This reveals the real user behavior that your ideal funnel might not capture. You can see alternative paths to conversion and understand which sequences work best.
Finding Problems in Your Funnel
Once you're measuring your funnel, the next step is finding the problems. Here's what to look for:
Steep Drop-offs
Look for steps where a large percentage of users suddenly drop off. If 80% of users abandon at one specific step, something is wrong there. Understanding your content marketing funnel can also help, as awareness and consideration stages lead to more qualified users at decision stages.
Common reasons for steep drop-offs:
- The step is confusing or unclear
- There's a technical error or bug
- You're asking for too much information
- The page loads slowly
- The user experience is poor (especially on mobile)
- There's a trust issue (unverified payment processor, unclear privacy policy, etc.)
- An unexpected cost or requirement appears
When you spot a steep drop-off, that's your top optimization priority.
Gradual Erosion
Sometimes the problem isn't one dramatic drop-off, but consistent erosion throughout the funnel. If each step loses 30-40% of users, your overall conversion suffers even though no single step looks terrible.
This pattern usually indicates a broader issue: unclear value proposition, low motivation, or a fundamental mismatch between what users expected and what they found.
Unexpected Patterns
Use Rybbit's segmentation features to look for unexpected patterns:
- "Why does organic search traffic convert much better than paid ads?"
- "Why do new visitors have higher conversion rates than returning visitors?"
- "Why does Tuesday have much lower conversion rates than Friday?"
These anomalies reveal opportunities and problems.
How to Optimize Your Funnel
Once you've identified problems, here's how to fix them:
Reduce friction. Every extra step, form field, and second of loading time reduces conversions. Be ruthless about eliminating unnecessary obstacles. If you can eliminate a form field and still get the information you need, do it. If you can combine two steps into one, do it.
Build trust. Users hesitate when they don't trust you. Add security badges, testimonials, clear privacy policies, and transparent pricing. The higher the stakes (especially with payment), the more trust matters.
Clarify next steps. Users abandon when they're unsure. Add progress indicators, clearly state what happens next, and preview what users are committing to.
Optimize for mobile. If your funnel shows significantly worse performance on mobile, that's your priority. Mobile optimization often means the biggest conversion wins because mobile is where you're losing the most people.
Address specific objections. For each drop-off point, think about what concerns users might have and address them proactively. High price? Show value. Long commitment? Offer a trial. Unclear process? Add more explanation.
Test your improvements. After you make changes, monitor your funnel again. Did conversions improve? By how much? What was the revenue impact?
Common Sales Funnel Types
Different types of funnels have different characteristics:
E-commerce Funnel Typical path: Product page → Add to cart → Checkout → Payment Typical overall conversion: 1-5% (varies widely by industry) Common problems: High abandonment at payment step, mobile checkout friction
For a deeper dive into e-commerce-specific optimization, check out our e-commerce analytics guide.
SaaS Signup Funnel Typical path: Landing page → Signup form → Email verification → Onboarding Typical overall conversion: 5-30% (highly variable) Common problems: Form abandonment, email verification friction, unclear onboarding value
Lead Generation Funnel Typical path: Landing page → Form submission → Thank you page → Sales engagement Typical overall conversion: 10-40% (depends on offer quality) Common problems: Form requests too much information, poor follow-up
Content/Download Funnel Typical path: Blog post → CTA click → Form → Download confirmation Typical overall conversion: 5-20% Common problems: Unclear value proposition for the content, form friction
Your specific funnel will differ, but the principles are the same: reduce friction, clarify value, build trust, and test improvements based on data.
Getting Started with Funnel Analysis in Rybbit
Here's your action plan:
Step 1: Define Your Key Conversion Goal What's the most important action a user can take on your site? Purchase? Signup? Form submission? Start there.
Step 2: Map Your Funnel Steps Working backward from your goal, identify 3-5 key steps that users should complete. Don't overcomplicate it—start simple.
Step 3: Set Up Funnel Tracking Go to Rybbit's Funnel feature and define your funnel steps. Use page paths, URLs, or custom events to define each step.
Step 4: Analyze Your Current Performance Look at your funnel data. Where's your biggest drop-off? What's your overall conversion rate? How does it vary by traffic source and device?
Step 5: Identify Your Top Opportunity Based on the data, what's your #1 priority? The step with the biggest drop-off and the most traffic is usually where you'll get the biggest improvement.
Step 6: Make One Improvement Don't change everything at once. Make one targeted improvement, monitor the results for a week or two, then evaluate. Did it work?
Step 7: Iterate Repeat this process. One improvement per cycle, measure results, learn, and improve again.
This cycle, repeated consistently, is how successful companies grow. They don't guess about what to improve. They measure, learn, and optimize based on data.
Key Takeaways
A sales funnel is simply the path your customers take from awareness to purchase. But understanding your funnel—really understanding it with data—is what separates companies that grow from companies that plateau.
Most businesses get traffic but can't convert it. The difference isn't always about getting more visitors. It's about converting more of the visitors you already have.
Rybbit Analytics gives you the visibility you need to understand your funnel, spot opportunities, and measure the impact of your improvements. You can see exactly where users drop off, which traffic sources convert best, and which optimizations actually work.
Start measuring your funnel today. Define your conversion goal, map your steps, and see where you're losing potential customers. Then make one improvement and measure the impact.
Consistent, data-driven optimization is how you turn visitors into customers.
Ready to measure your sales funnel? Check out Rybbit's documentation on Funnels, Goals, and Journeys to get started.
Need help? Join the Rybbit Discord community at discord.gg/DEhGb4hYBj or visit our documentation.
Related Reading: