What is Multivariate Testing? Examples and How to Run Tests with Rybbit
A complete guide to multivariate testing - how it works, when to use it, real-world examples, and how to run multivariate tests with Rybbit Analytics
You have a checkout page that isn't converting as well as you'd like. The problem is obvious: something needs to change. But what?
The button color? The copy? The form layout? The trust badge position? All of the above?
If you test each change one at a time (button color this week, copy next week), you're looking at months of experimentation. By then, you've lost potential customers and revenue.
This is where multivariate testing comes in. Instead of testing one variable at a time, you test multiple variables simultaneously. It's faster, cheaper, and gives you deeper insights into what actually drives conversions.
Let's walk through what multivariate testing is, how it works, when to use it, and how to implement it with Rybbit Analytics.
What is Multivariate Testing?
Multivariate testing (MVT) is an experimentation method where you test multiple variables at the same time to see how they work together and individually.
Example: Instead of testing:
- Just the button color (red vs blue)
You test:
- Button color (red vs blue) × Button copy ("Buy Now" vs "Add to Cart") × Form fields (3 fields vs 5 fields)
This creates multiple combinations (variations) that users are randomly exposed to. Then you measure which combination performs best.
Key distinction: Multivariate testing is different from A/B testing:
- A/B Testing: Test one variable (button color)
- Multivariate Testing: Test multiple variables simultaneously (button color + copy + layout)
Think of multivariate testing as A/B testing on steroids. You're not just comparing two options. You're exploring a matrix of possibilities.
How Multivariate Testing Works
Let's say you're running a multivariate test on your landing page with three variables:
- Headline: Option A ("Save Time") vs Option B ("Save Money")
- CTA Button: Option A ("Start Free") vs Option B ("See Demo")
- Image: Option A (Product screenshot) vs Option B (Customer testimonial)
That creates 2 × 2 × 2 = 8 possible combinations (variations).
This is similar to testing different stages in your content marketing funnel, but focused specifically on optimization within a single page or experience.
| Variation | Headline | Button | Image |
|---|---|---|---|
| 1 | Save Time | Start Free | Screenshot |
| 2 | Save Time | Start Free | Testimonial |
| 3 | Save Time | See Demo | Screenshot |
| 4 | Save Time | See Demo | Testimonial |
| 5 | Save Money | Start Free | Screenshot |
| 6 | Save Money | Start Free | Testimonial |
| 7 | Save Money | See Demo | Screenshot |
| 8 | Save Money | See Demo | Testimonial |
Each visitor randomly sees one of these 8 combinations. You then measure which combination converts the best.
The Math Behind Multivariate Testing
Multivariate testing uses factorial design - a statistical method that efficiently tests multiple variables and their interactions.
Here's the key insight: A multivariate test gives you more data than running separate A/B tests.
Example: If you want to test 3 variables with 2 options each:
- Separate A/B tests: 3 tests × 2 weeks each = 6 weeks to get all the data
- One multivariate test: 2 weeks to test all 8 combinations simultaneously
But there's a catch: You need enough traffic to detect winners across all combinations.
Rule of thumb: Each variation needs at least 100-200 conversions to be statistically significant. So if you have 8 variations, you need 800-1,600 conversions total.
If your traffic is lower, you might not have enough data to reach statistical significance. That's when A/B testing individual changes becomes smarter.
Multivariate Testing vs A/B Testing: When to Use Each
Use A/B Testing when:
- You have lower traffic (< 100 conversions/week)
- You're testing one specific hypothesis (Does red button convert better than blue?)
- You need results fast and traffic is limited
- You're optimizing a single element (headline, CTA, etc.)
Use Multivariate Testing when:
- You have higher traffic (> 500 conversions/week)
- You want to understand how multiple elements interact
- You have time to gather data (2-4 weeks)
- You're trying to optimize an entire page experience
- You want to find unexpected winner combinations
Real example: Slack probably uses multivariate testing on their signup page because they have massive traffic and want to optimize multiple elements (headline, CTA, form fields, imagery). A small SaaS with 50 signups/week would be better off with A/B testing one element at a time.
Real-World Multivariate Testing Examples
Example 1: E-commerce Product Page
You're running an online bookstore and want to increase purchases. For more details on e-commerce optimization, see our e-commerce analytics guide.
Variables:
- Price display: Show as "$15.99" vs Show as "Only 1 left - $15.99" (scarcity)
- Social proof: Show 1,200 reviews vs Show 4.8★ rating
- Shipping info: "FREE shipping" vs "FREE 2-day shipping"
Result: The combination of scarcity + star rating + specific shipping info converts 23% better than the baseline.
Finding: Customers care more about shipping specificity than just the word "free."
Example 2: SaaS Pricing Page
You're testing what makes people upgrade.
Variables:
- Pricing comparison: Monthly vs Annual prominent
- Social proof: "Used by 500+ companies" vs "10,000+ users"
- CTA color: Blue vs Green
Result: Annual pricing prominent + user count + green button wins, converting 18% higher.
Finding: B2C appeals more to user quantity; the specific button color matters (small but consistent winner).
Example 3: Mobile App Onboarding
You want users to complete onboarding.
Variables:
- Progress indicator: Shows steps (Step 1/4) vs No progress indicator
- Skip option: Visible skip button vs Hidden skip option
- Visuals: Animation + icons vs Static images
Result: Progress indicator + no visible skip + animations convert 31% better.
Finding: Psychological commitment (progress bar) + removing friction (hidden skip) + engagement (animation) work together better than individually.
The Real Power: Interaction Effects
Here's why multivariate testing is powerful: variables don't exist in a vacuum.
In the onboarding example above, the progress indicator might only improve completion by 5% on its own. But combined with animations and a hidden skip button, it jumps to 31%.
This is called an interaction effect - when variables work better together than they would individually.
This is nearly impossible to discover with A/B testing alone. You'd test progress indicator vs no progress indicator and see a small 5% lift. You might even conclude it's not worth it. But in combination with other changes, it's powerful.
Multivariate testing reveals these hidden synergies.
How to Run a Multivariate Test with Rybbit
Rybbit Analytics lets you set up and analyze multivariate tests by tracking variations and comparing performance metrics.

The Rybbit dashboard provides detailed metrics that let you compare performance across your different test variations and identify winning combinations.
Step 1: Define Your Variables and Create Variations
First, identify what you want to test. Let's say you're optimizing your signup page:
Variables:
- Headline: "Start Free" vs "See How It Works"
- Button color: Blue vs Green
- Form fields: 2 fields vs 4 fields
Result: 2 × 2 × 2 = 8 variations to test
Step 2: Implement Variation Tracking with Rybbit
When you expose users to different variations, track which variation each user sees. Use Rybbit's event tracking to record variation assignments. Refer to the event tracking documentation for specific implementation details on how to properly record variation assignments.
Step 3: Track Conversion Events
Track when users complete the desired action (signup, purchase, etc.). See the event tracking documentation for details on how to properly record conversion events in Rybbit.
Step 4: Analyze Results in Rybbit
Use Rybbit's filtering and segmentation to compare conversion rates across variations:
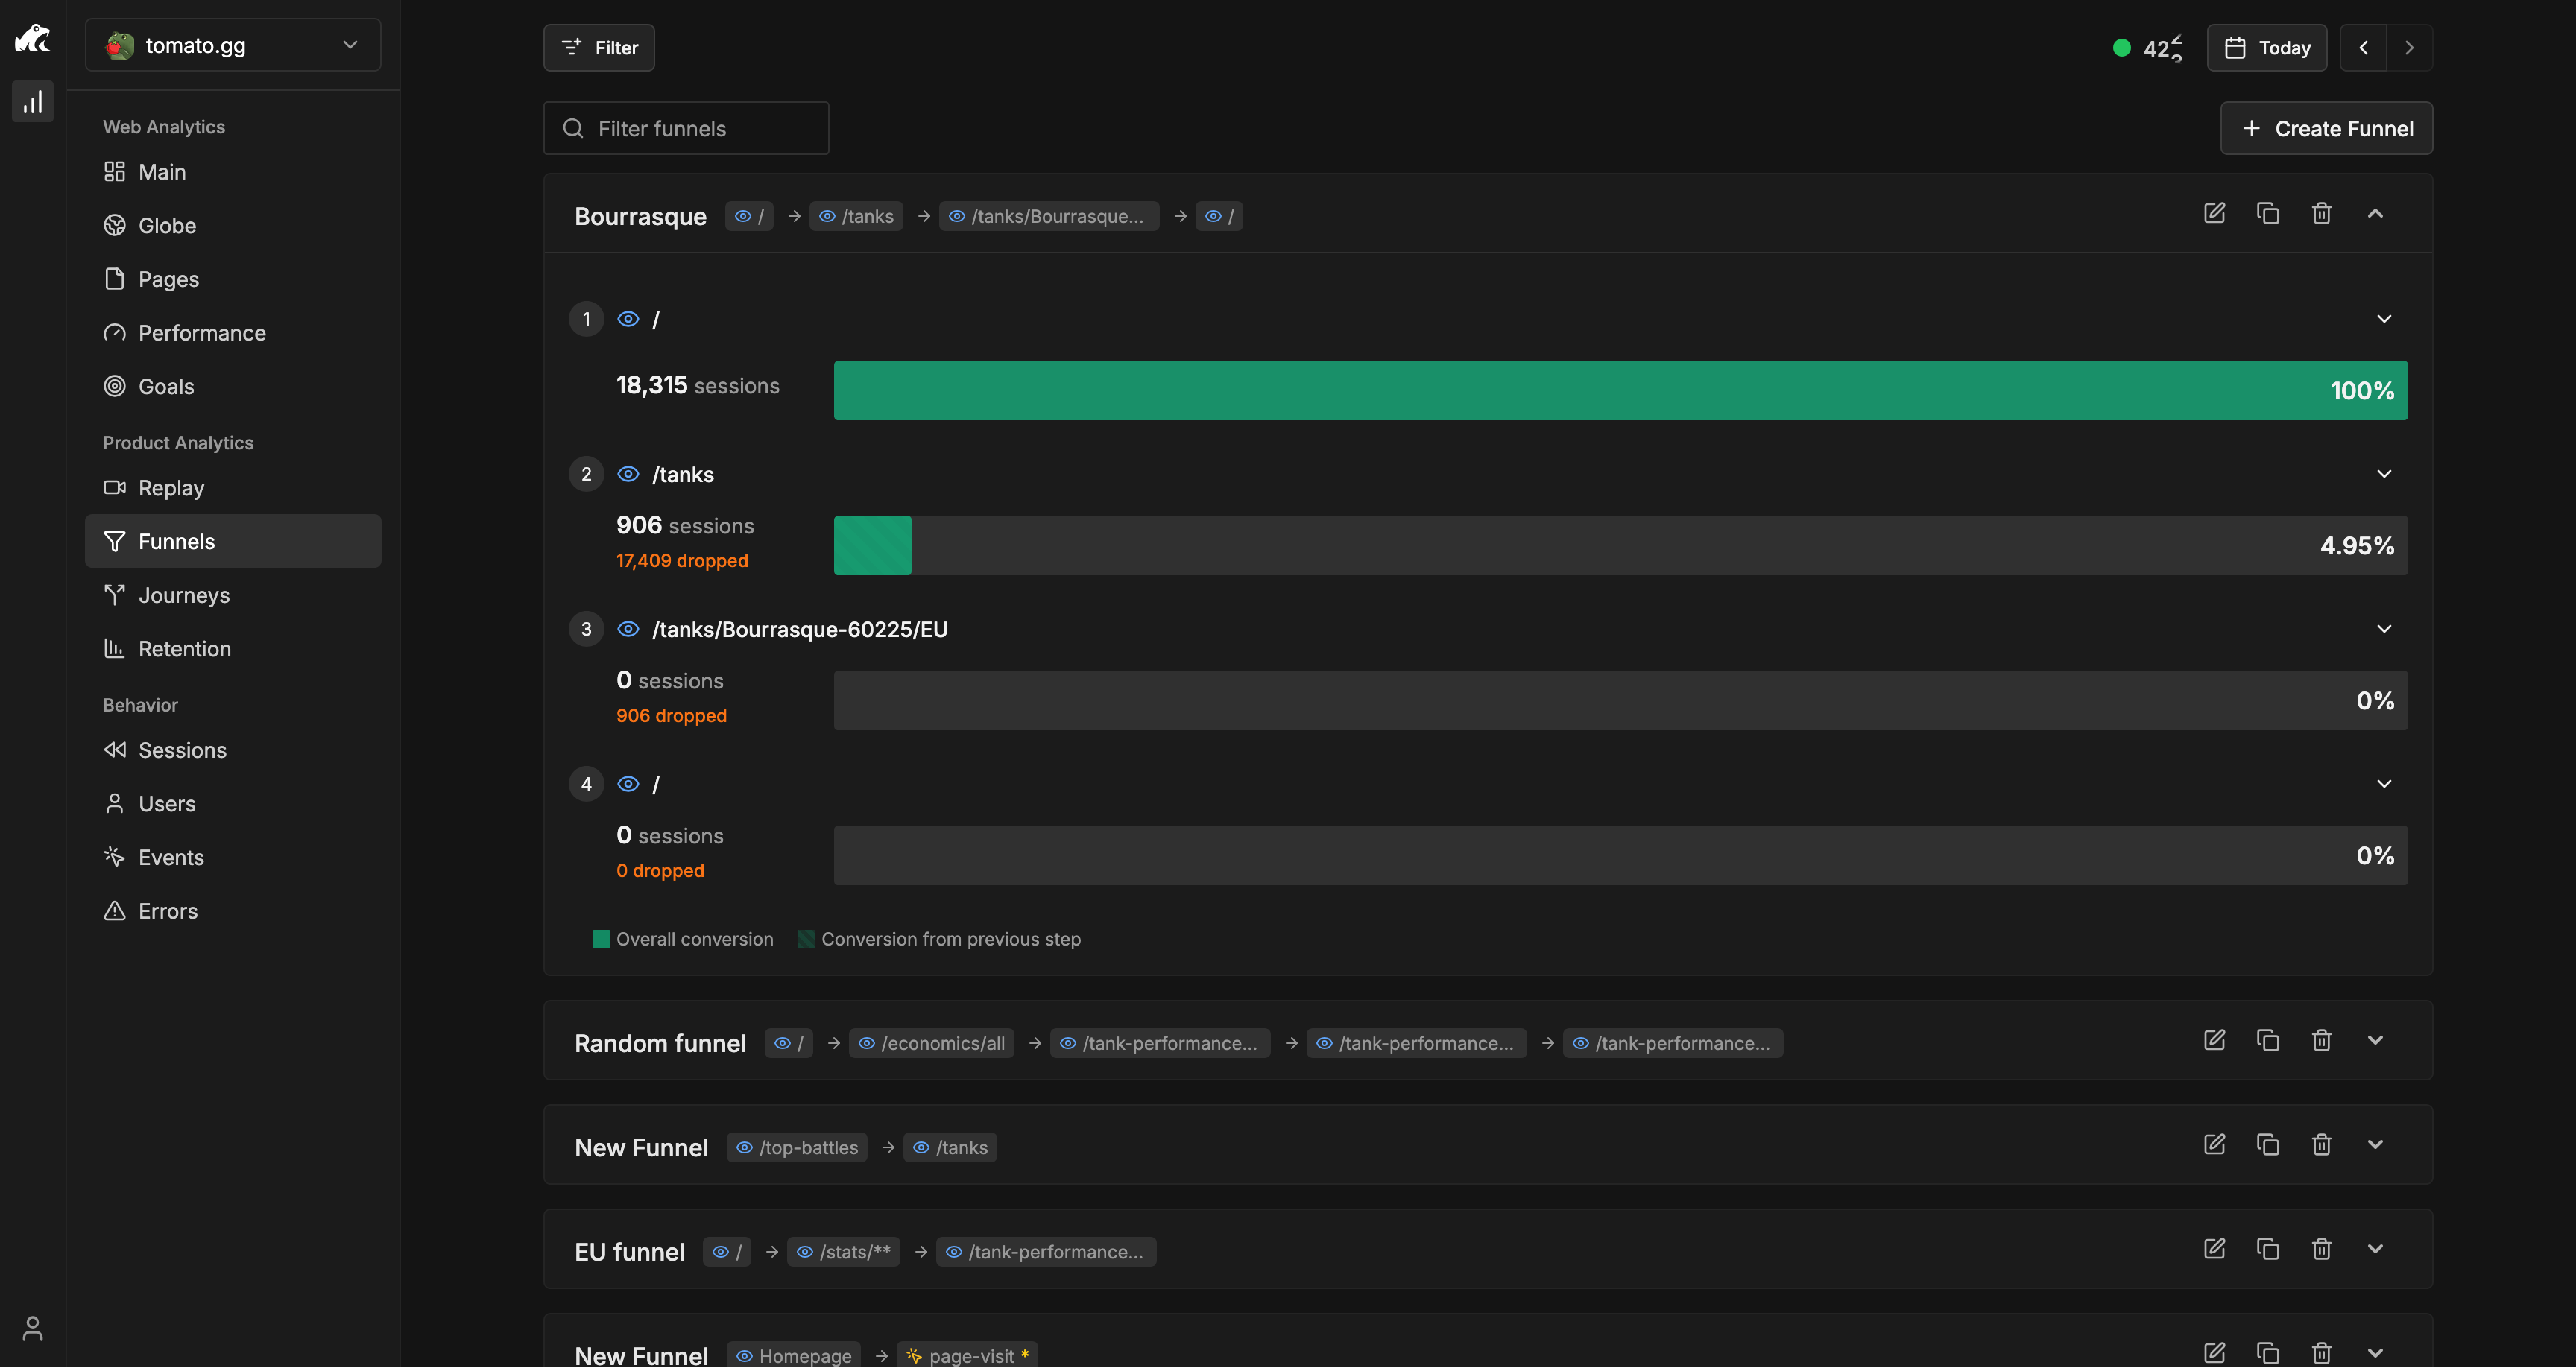
The Funnels section in Rybbit allows you to create custom conversion funnels and view performance across your different test variations, making it simple to see which combination is winning.
- Go to Product Analytics → Funnels
- Create a funnel from "Signup_Variation_Shown" to "Signup_Completed"
- Use the "Breakdown by" option in the Funnels interface to select your variation property and compare which combination wins

Use the Pages dashboard to analyze which page variations are performing best, showing traffic and engagement metrics for each variation.
What you'll see:
- Conversion rate for each variation
- Which combinations perform best
- Statistical significance (are differences real or random?)
- How long it takes to reach statistical significance
Step 5: Analyze Interaction Effects
To understand which variable combinations matter most, create additional analysis by tracking the individual variables within your events. This allows you to create custom cohorts by each variable in Rybbit to see conversion rates for each combination.
Step 6: Determine Statistical Significance
This is crucial: Don't stop the test too early just because one variation is winning.
Rybbit doesn't automatically calculate statistical significance (you'll need to use an external tool like this calculator), but you can estimate:
Rule of thumb: Run the test until each variation has at least 100-200 conversions.
If you have 8 variations, that's 800-1,600 total conversions needed. At 500 conversions/week, that's about 2-3 weeks.
Step 7: Document Learnings
After your test concludes, document what you learned about which variables and combinations drove better results. This builds institutional knowledge for future tests and helps you understand what types of changes are worth pursuing.
Multivariate Testing Best Practices
1. Start Simple
Don't test 5 variables with 3 options each on your first attempt. That's 3^5 = 243 variations. You'll never reach statistical significance.
Start with 2-3 variables, 2 options each. That's 4-8 variations - manageable and testable.
2. Test Independent Variables
Make sure your variables don't overlap. Testing both "button color" and "button style" at the same time confuses results.
Good: Button color + Headline + Form length Bad: Button color + Button size (these affect each other)
3. Have Enough Traffic
This is non-negotiable. Low-traffic sites should do A/B testing, not multivariate testing.
Traffic check: (Traffic per variation per week) × (Number of variations) = Do you have enough?
If variation 1 gets 50 visitors/week and you have 8 variations, each gets about 6-7 visitors/week. That's not enough to measure conversions accurately.
4. Run Tests Long Enough
Don't stop after 1 week. Run for at least 2 full weeks to account for day-of-week effects (Monday traffic might differ from Friday traffic).
5. Test the Right Metrics
Don't just track clicks. Track conversions - the action that matters to your business.
- E-commerce: Track purchases, not just add-to-cart
- SaaS: Track signups, not just clicks
- Content: Track time-on-page, not just visits
6. Understand Diminishing Returns
Each additional variable you test increases complexity exponentially. 2 variables = 4 combinations. 3 variables = 8 combinations. 4 variables = 16 combinations.
At some point, the added complexity outweighs the benefit. Usually 3-4 variables is the sweet spot.
7. Have a Hypothesis
Don't test random combinations. Have a theory about what will work and why.
Good hypothesis: "We think shortening the form (2 fields vs 4) combined with a specific CTA ('Start Free' vs 'See Demo') will increase conversions because it reduces friction while being clear on value."
Bad hypothesis: "Let's test random stuff and see what sticks."
Common Multivariate Testing Mistakes
Mistake 1: Not having enough traffic
- You can't trust results with only 10-20 conversions per variation
- Minimum 100-200 conversions per variation
Mistake 2: Too many variables
- Testing 5 variables = 32 combinations at minimum
- You need massive traffic to reach statistical significance
Mistake 3: Stopping too early
- "We have a winner after 3 days!" - No, you need 2-3 weeks minimum
- Variance will make random variation look like a winner early on
Mistake 4: Not tracking properly
- If you don't know which variation each user saw, you can't analyze results
- Always track variation assignment with every event
Mistake 5: Testing insignificant changes
- Testing button color shade (navy vs dark blue) is a waste of time
- Test changes that could meaningfully impact behavior
Mistake 6: Not planning for "no winner"
- Sometimes all variations perform similarly
- That's still valuable data - it means this area isn't a lever for improvement
When Multivariate Testing Isn't the Right Choice
Don't use multivariate testing if:
- You have low traffic - Stick to A/B testing one element at a time
- You need results fast - Multivariate tests take 2-4 weeks
- Changes are risky - If one variation could break the experience, test one thing at a time
- Variables are intertwined - If changing one necessarily changes the other, you can't isolate effects
- You're testing radical redesigns - This is better suited to A/B testing or user research
Do use multivariate testing if:
- ✅ You have 500+ conversions per week
- ✅ You want to optimize multiple elements together
- ✅ You're willing to wait 2-3 weeks for results
- ✅ You want to discover interaction effects
- ✅ You're testing independent variables
Multivariate Testing with Rybbit: Real Example
Let's walk through a complete multivariate testing approach.
Scenario: E-commerce Checkout Page
You run an online store and want to increase purchase completion.
Current state: 1,000 visitors/week to checkout page.
What you want to test:
- Payment options prominence: Show all options vs Highlight most popular
- Trust badge position: Top of form vs Bottom of form
- Shipping messaging: "Ships in 1-2 days" vs "Free shipping"
That's 2 × 2 × 2 = 8 variations to test
Week 1-3: Run the Test
Implement variation tracking using Rybbit's event system. Record when each user sees a variation and when they complete (or abandon) the checkout.
Week 4: Analyze in Rybbit
Use Rybbit's filtering and segmentation features to compare conversion rates across your variations.
Look for:
- Which variation has the highest conversion rate
- Whether certain variable combinations outperform others
- Patterns in which users from different sources convert better with specific variations
The Bottom Line
Multivariate testing is powerful because it's efficient. Instead of spending months testing one variable at a time, you test multiple variables simultaneously and discover how they interact.
The key requirements are:
- Enough traffic - At least 500+ conversions per week
- Clear variables - Independent factors you want to test
- Time - 2-4 weeks to gather data
- Proper tracking - Know which variation each user saw
- Statistical rigor - Wait for real significance, not random luck
With Rybbit's event tracking and analytics, you can set up and measure multivariate tests without complex testing platforms. You get the data, you make the decisions.
The companies that win are the ones that test relentlessly and act on data. Multivariate testing is how you scale optimization from "one variable at a time" to "multiple hypotheses, simultaneously."
Related Reading:
- Behavior Analytics - Events Tab
- Behavior Analytics - Users Tab
- Track Custom Events
- Product Analytics - Funnels Guide
- Product Analytics - Journeys Dashboard
- Blog: Churn Rate vs Retention Rate
- Blog: E-commerce Analytics
- Blog: Content Marketing Funnel
- Blog: Sales Funnel Guide
- Blog: Website Traffic Drop Analysis
- Blog: Web Analytics Guide