What is Web Analytics? A Complete Guide to Understanding Your Visitors with Rybbit
Learn what web analytics is and why Rybbit is the best privacy-first alternative to Google Analytics
What is Web Analytics? A Complete Guide to Understanding Your Visitors with Rybbit
Introduction
Understanding how visitors interact with your website is crucial for success. But with legacy analytics tools collecting excessive data, compromising privacy, and overwhelming you with complexity, many businesses struggle to get actionable insights. That's where modern web analytics comes in—and Rybbit is leading the charge as the open-source, privacy-first alternative that makes analytics simple, powerful, and honest.
In this guide, we'll explore what web analytics is, why it matters, and why Rybbit stands out as the best choice for businesses serious about understanding their users without sacrificing privacy.
What is Web Analytics?
Web analytics is the collection, measurement, and analysis of data about visitors and their behavior on your website. It answers fundamental questions: Where do your visitors come from? What pages do they view? How long do they stay? Do they complete your goals? Are they returning or new?
At its core, web analytics helps you understand the customer journey. Instead of guessing what works, you can make data-driven decisions backed by real user behavior patterns.
Traditional Web Analytics vs. Modern Analytics
Traditional web analytics (like Google Analytics) has been the industry standard for years. It's free, comprehensive, and widely adopted. However, it comes with significant tradeoffs:
- Privacy concerns: GA4 sends data to Google's servers in the US, raising GDPR, CCPA, and other regulatory compliance questions
- Cookie-dependent: Relies on cookies that are increasingly blocked by browsers and user consent requirements
- Overly complex: The interface is confusing for non-technical users; many teams struggle to use the available features effectively
- Vendor lock-in: Your data lives in Google's ecosystem
- Opaque algorithms: You don't know exactly how your data is processed
Modern web analytics (represented by tools like Rybbit, Plausible, and Fathom) flips the script:
- Privacy-first: Cookie-free tracking, GDPR-compliant out of the box, data stays in your control
- Simplicity: Clean dashboards that show what matters, not feature overload
- Transparency: You can see exactly how your data is collected and processed
- Data ownership: Your analytics data belongs to you, not a third party
Why Web Analytics Matters
1. Understand Your Audience
Web analytics reveals who your visitors are and where they come from. With Rybbit's advanced location tracking spanning country, region, and city levels, combined with sophisticated filtering across 15+ dimensions, you can create detailed visitor profiles. You'll know if your audience is concentrated geographically, what devices they use, and how different segments behave differently.
2. Optimize Conversion Rates
The average website leaves money on the table. Rybbit's funnel analysis and session replay capabilities let you see exactly where visitors drop off in your conversion process. Understanding your sales funnel helps you identify which steps are causing the most drop-off. Watch a session replay to see if users are confused by your checkout flow or abandoning your signup form at a specific step. Then optimize based on real behavior, not assumptions.
3. Track Goal Progress
Whether your goal is generating leads, selling products, or building community, Rybbit lets you define custom goals and track them across all your pages. See which traffic sources, devices, and user segments drive your most valuable conversions. This transforms scattered activity into a coherent picture of what actually drives revenue.
4. Monitor Real-Time Activity
Rybbit's real-time dashboard lets you see visitor activity as it happens. A new campaign launching? Watch the traffic spike in real time. Deploy a new feature? Immediately see how users interact with it. This immediate feedback loop enables rapid iteration and quick problem detection.

5. Improve User Retention
One-time visitors are nice, but returning customers drive sustainable growth. Understanding churn rate vs retention rate is critical for long-term business health. Rybbit's retention analysis shows you which cohorts of users keep coming back and which ones don't. User journeys reveal the path successful users take, helping you replicate that experience for others.
Core Web Analytics Metrics Explained
When you open Rybbit's dashboard, here are the essential metrics you'll encounter:
Sessions
A session is a collection of user interactions on your website. If someone visits, browses three pages, and leaves, that's one session. If they return the next day, that's a new session. Sessions help you understand visit frequency and user engagement patterns.
Unique Users
The actual number of distinct people visiting your site. This differs from sessions because one person can create multiple sessions over time. Tracking unique users helps you understand audience growth.
Pageviews
How many times pages were viewed. High pageviews with low unique users suggests power users diving deep. High unique users with low pageviews might indicate visitors aren't finding what they need.
Bounce Rate
The percentage of visitors who leave without taking action (no additional pageviews, events, or interactions). A high bounce rate on your homepage might signal unclear messaging or poor traffic quality. A high bounce rate on a specific article? That might be perfectly normal—they got what they came for.

Session Duration
Average time spent on your site per session. Longer duration typically indicates engagement, though context matters. A blog post reader spending 10 minutes is engaged; a checkout abandoner staying 12 minutes might be frustrated.
Custom Events
Beyond pageviews, Rybbit lets you track custom events with rich JSON properties. Track video plays, button clicks, form submissions, or any behavior that matters to your business. This transforms analytics from passive observation to active insight capture.

Why Rybbit is the Best Web Analytics Solution Available
We could throw marketing terms at you, but let's be direct: Rybbit is the best because it solves the actual problems businesses face with modern analytics. Here's why:
1. Complete Data Ownership (Open Source + Self-Hosting)
Rybbit is open source under AGPL-3.0. You can inspect every line of code. Deploy it on your own VPS and your analytics data never leaves your infrastructure. Want to know exactly how tracking works? Read the source code. Need custom modifications? Fork and build.
Compare this to:
- GA4: Your data goes to Google. You have no visibility. They collect whatever they want.
- Plausible: Some features require their cloud. Limited self-hosting options.
- Cloudflare: Proprietary, limited customization.
With Rybbit, your analytics are truly yours.
2. Privacy-First Architecture
Rybbit is cookieless and GDPR-compliant by design. No consent banners needed. No data processors in foreign jurisdictions. No regulations violations hiding in your terms of service.
How does Rybbit track without cookies? It uses a combination of advanced fingerprinting techniques and IP-based session tracking, all processed on your own infrastructure. Your data never gets sold or shared with third parties because there are no third parties—the system runs on your servers.
Real impact: Some European SaaS companies have raised concerns about GA4's compliance status. Rybbit's design addresses these concerns through its cookieless, privacy-first approach.
3. Superior Session Replay Technology
Rybbit isn't just metrics—it's understanding. Session replay shows actual user behavior. See how someone navigates your site, where they click, what frustrates them, what delights them.
Watch a customer abandon your checkout and see exactly why. Was it confusing? Too many steps? A broken button? Session replay answers these questions that metrics alone cannot.
4. Advanced Filtering & Segmentation Across 15+ Dimensions
Most analytics tools offer basic filters. Rybbit's advanced filtering system lets you drill deep:
- Show me mobile users from Germany who visited the pricing page but didn't convert
- Which dark mode users spend the most time on our site?
- Filter by custom event properties: "users who played video AND visited checkout"
- Combine multiple conditions with AND/OR logic
GA4 calls this "limited" segmentation for a reason—building complex segments is painful. Rybbit makes sophisticated analysis effortless.

5. Powerful Visualization Tools
Rybbit's advanced map visualization is stunning and informative. See visitor distribution across countries, regions, and cities with intuitive heat maps. Understand geographic patterns at a glance.
Meanwhile, GA4's basic country-level maps look like they're from 2005.
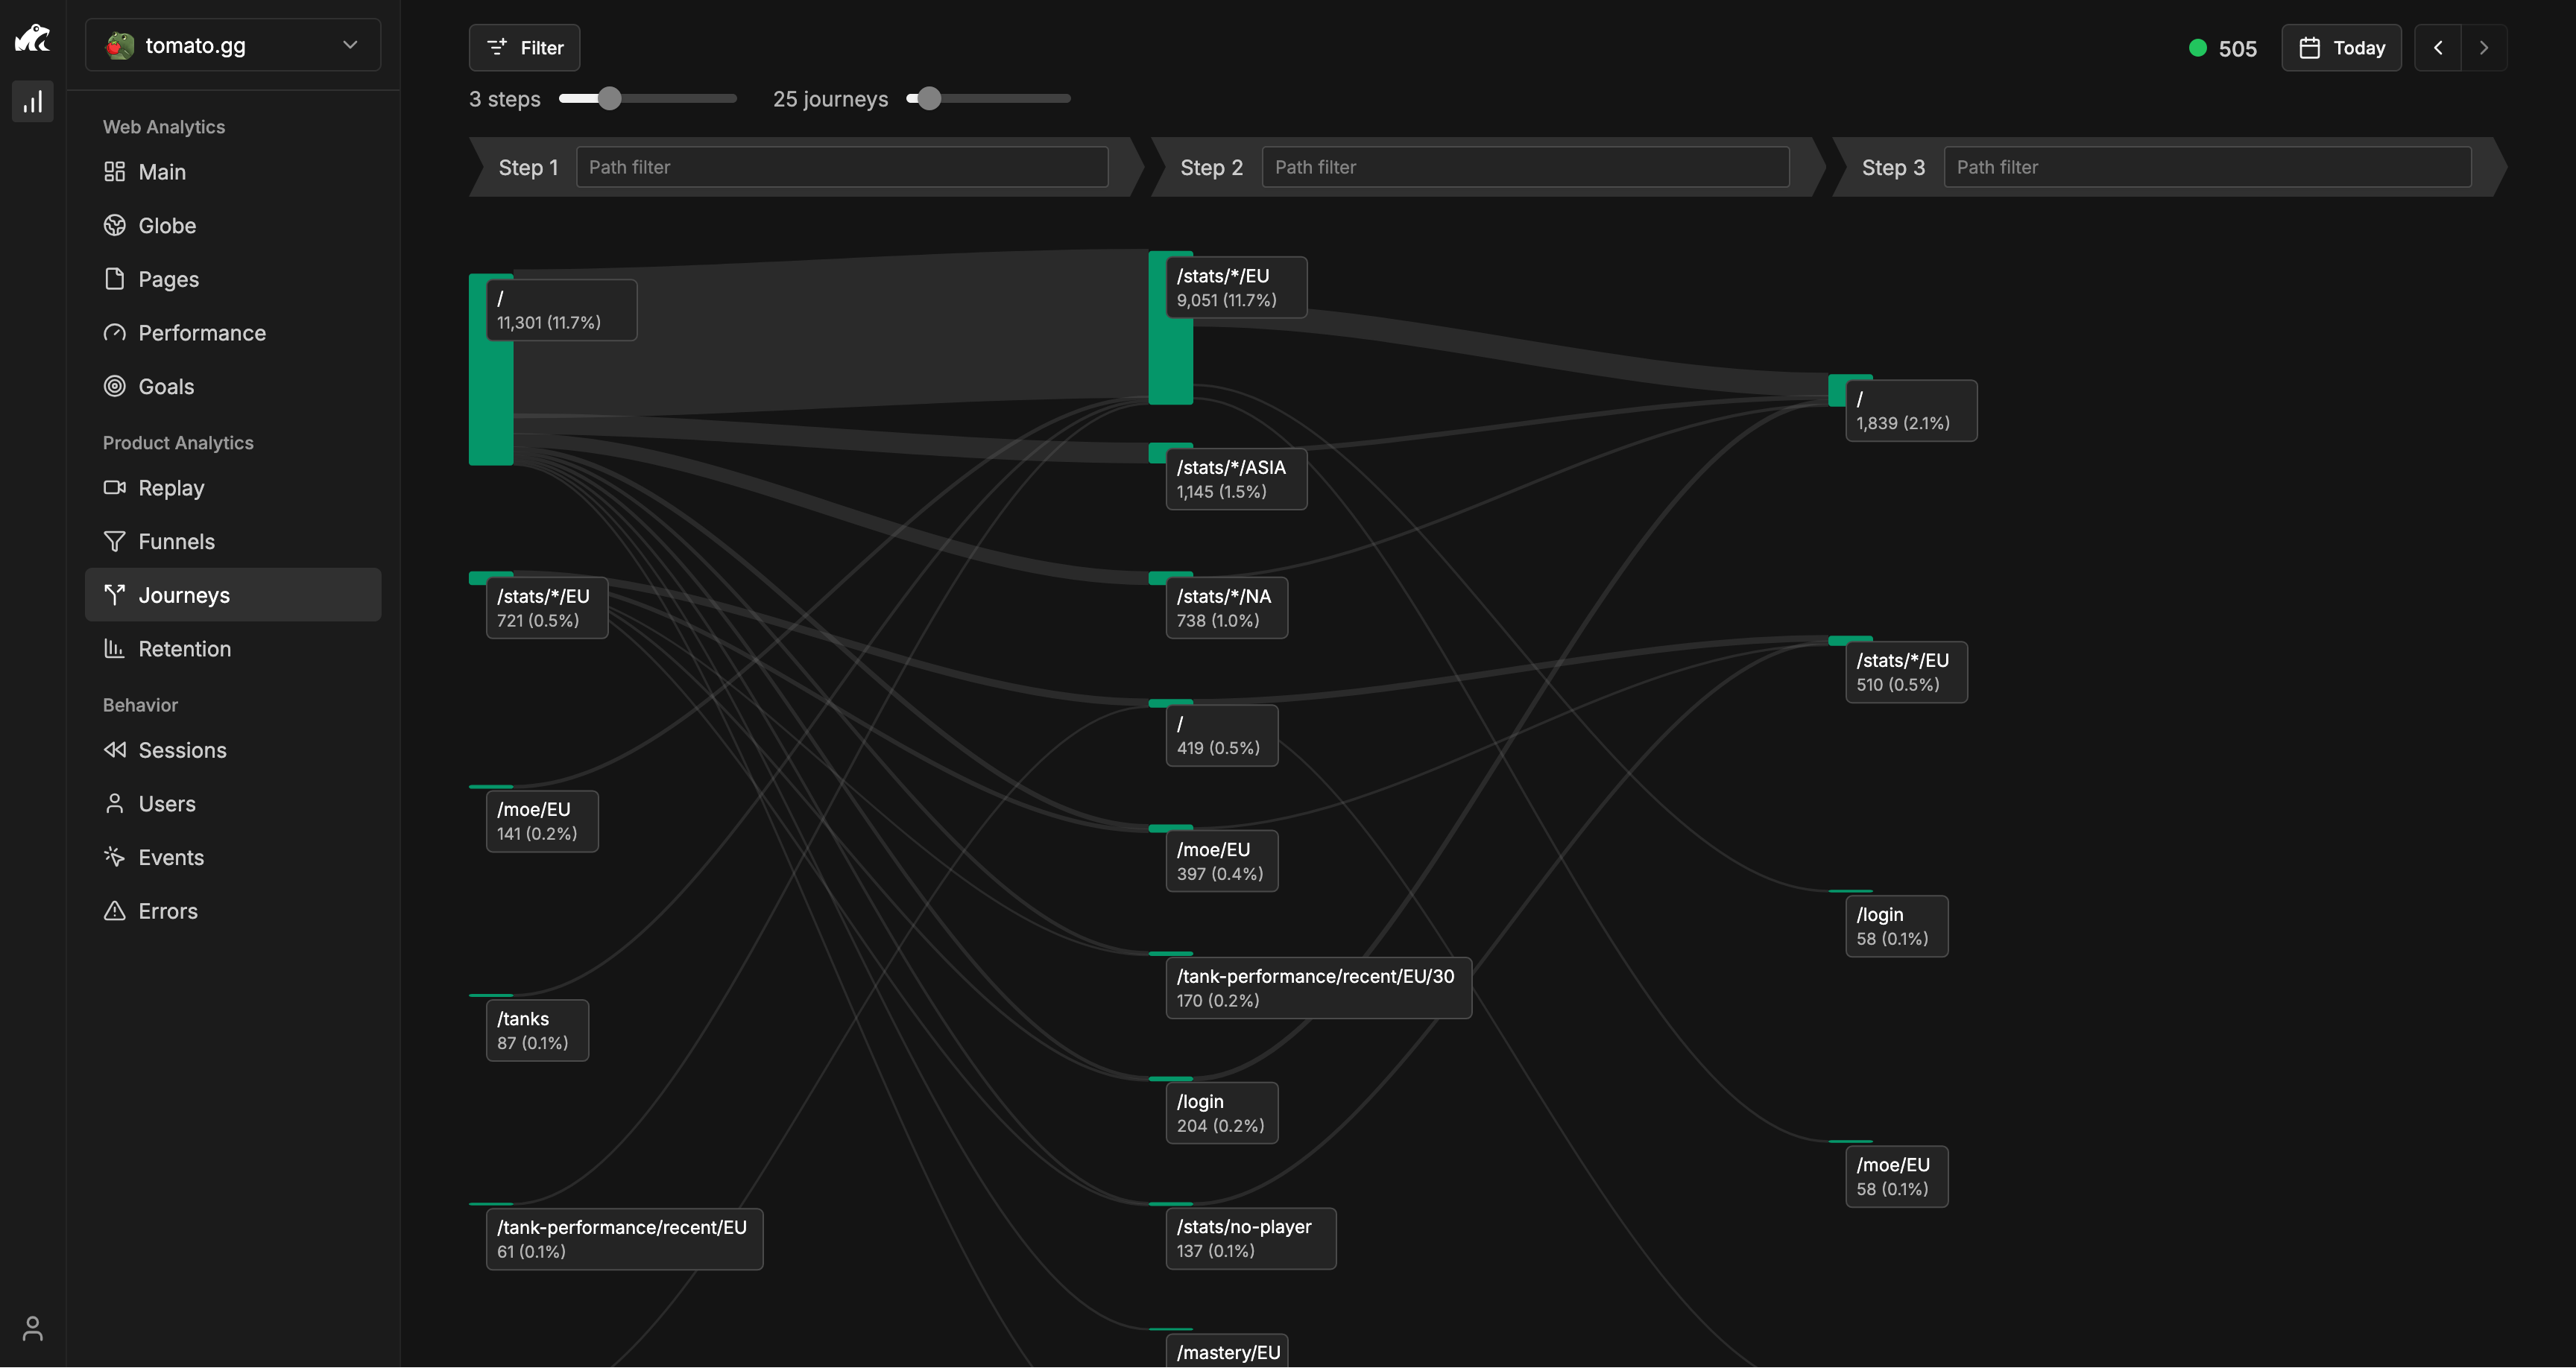
6. User Journeys & Path Analysis
Want to understand the actual path users take through your site? User journeys show how visitors move between pages and where they drop off. Identify your most successful user flows and replicate them. Spot problematic paths causing abandonment.
This is standard with an affordable plan in Rybbit (see pricing). GA4 makes it difficult. Plausible doesn't offer it at all.
7. Funnel Analysis & Conversion Tracking
Define custom funnels tracking users through your conversion process:
- Signup flow: landing page → signup form → email verification
- Purchase funnel: product browse → add to cart → checkout → payment
- Content funnel: discover content → read → comment → share
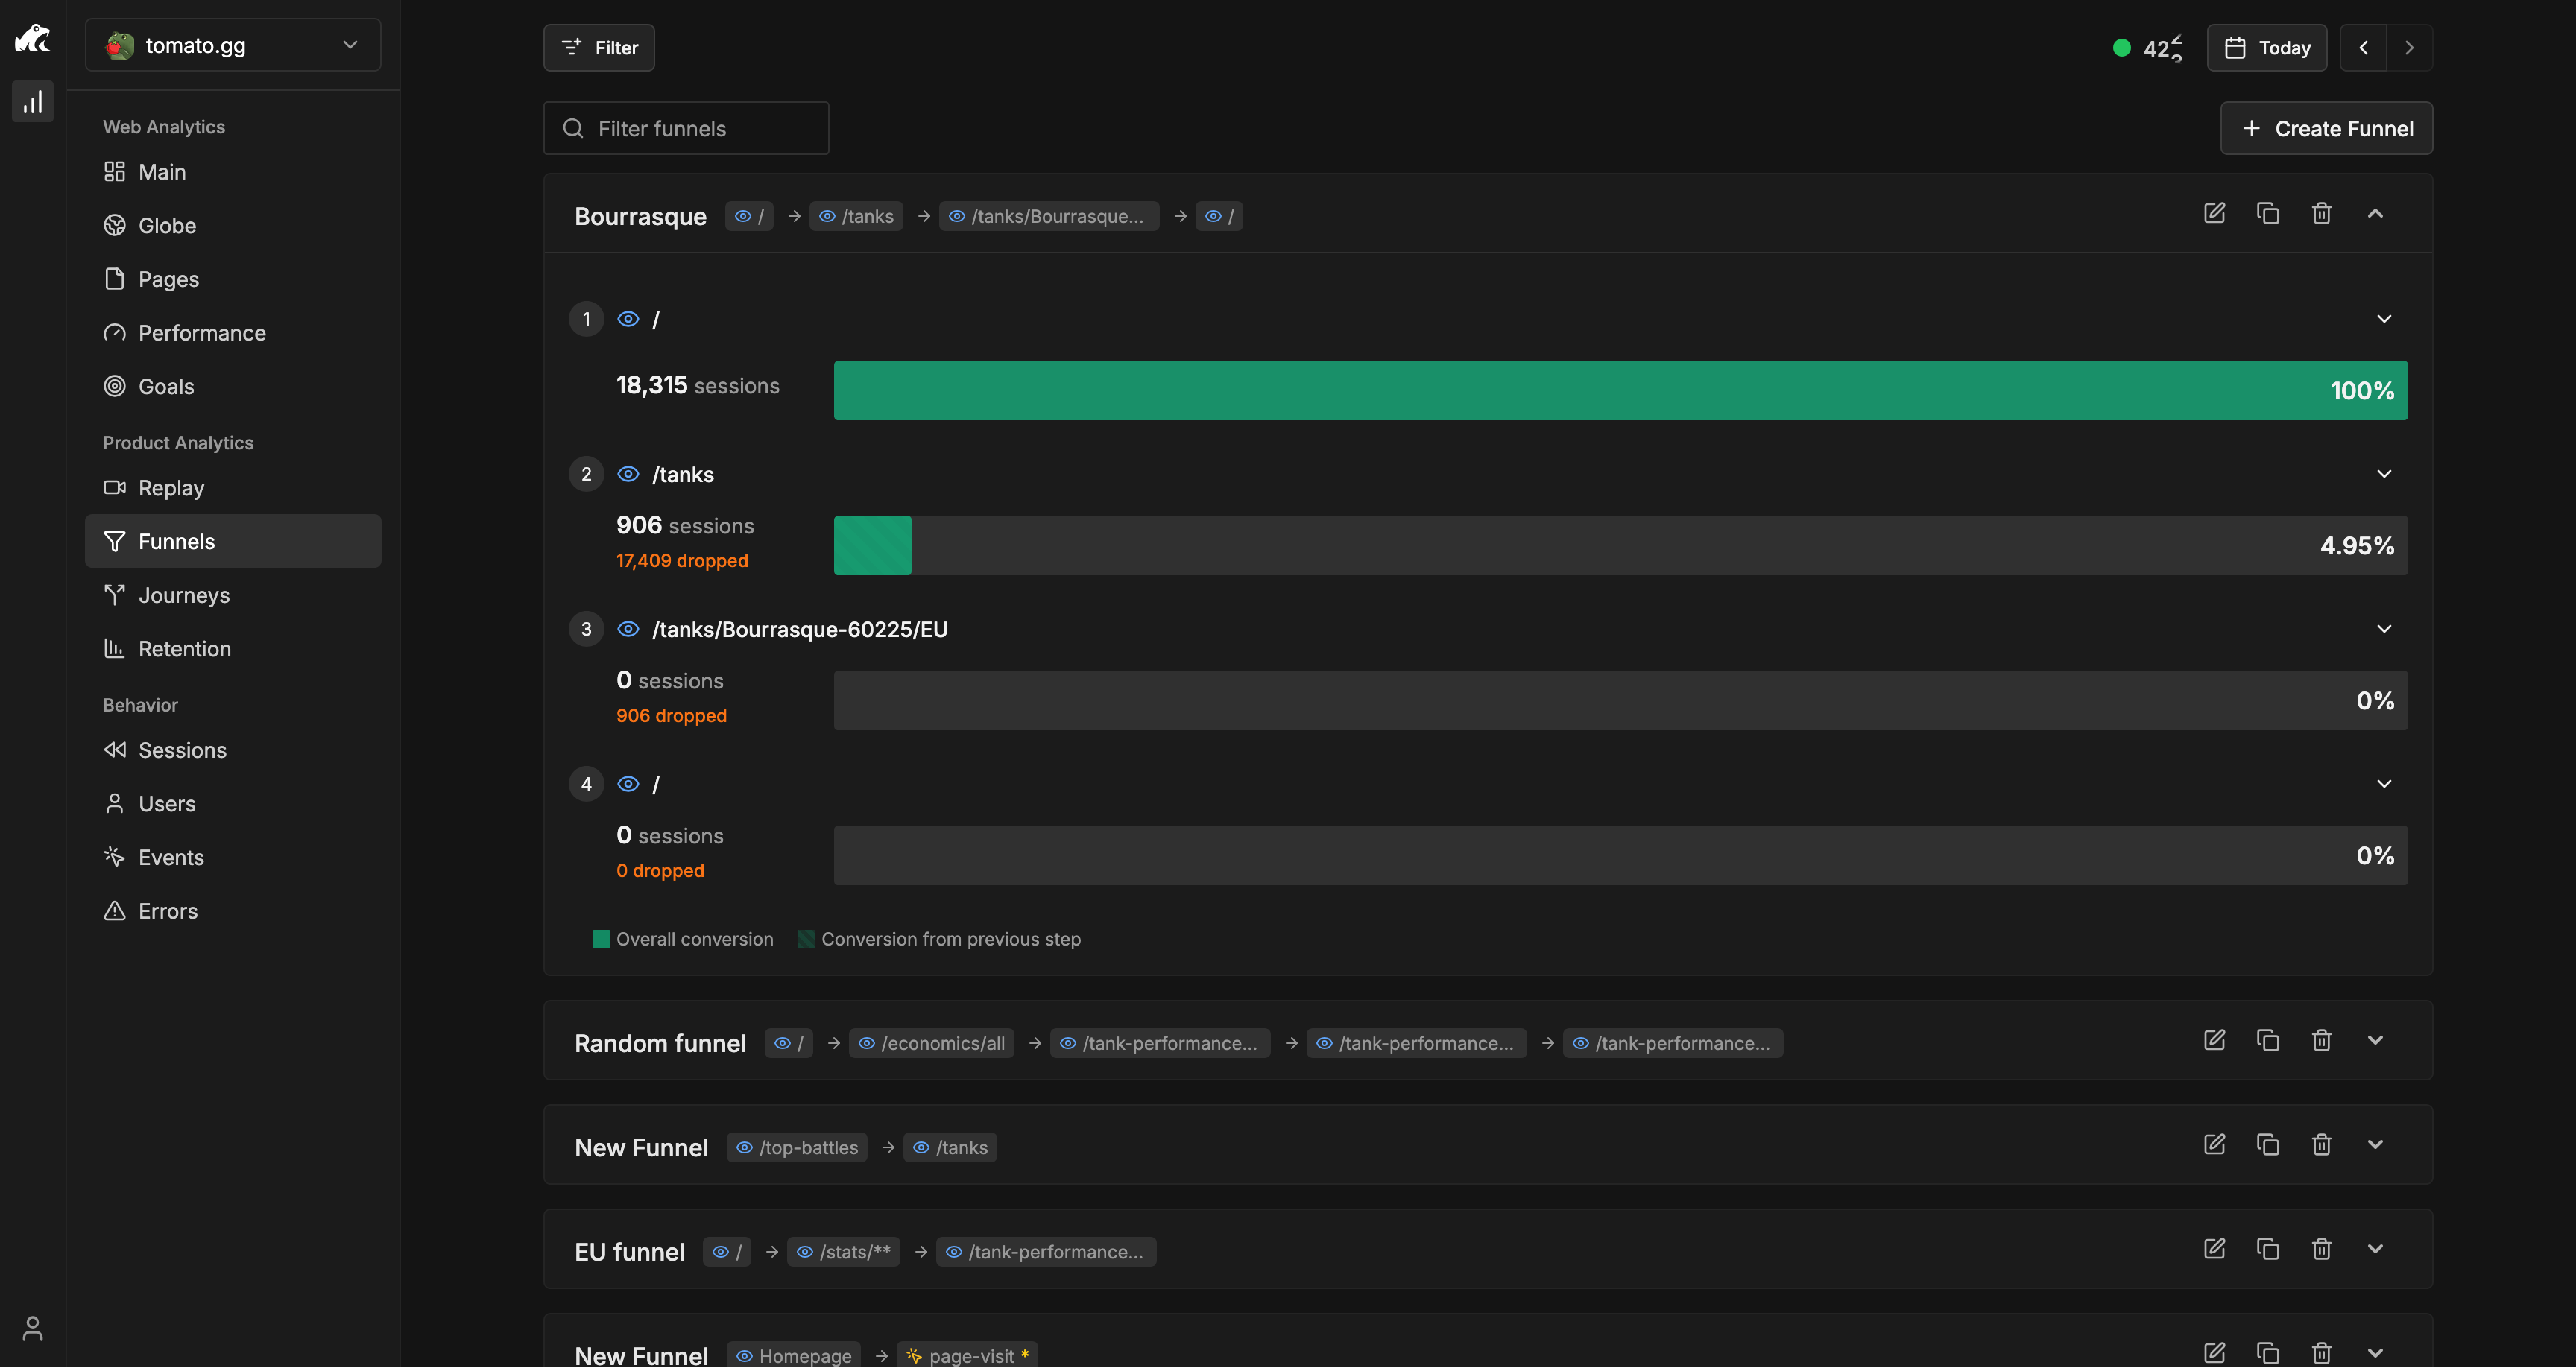
See exactly where users abandon. Identify bottlenecks. Optimize each step. Rybbit makes this visual and actionable.
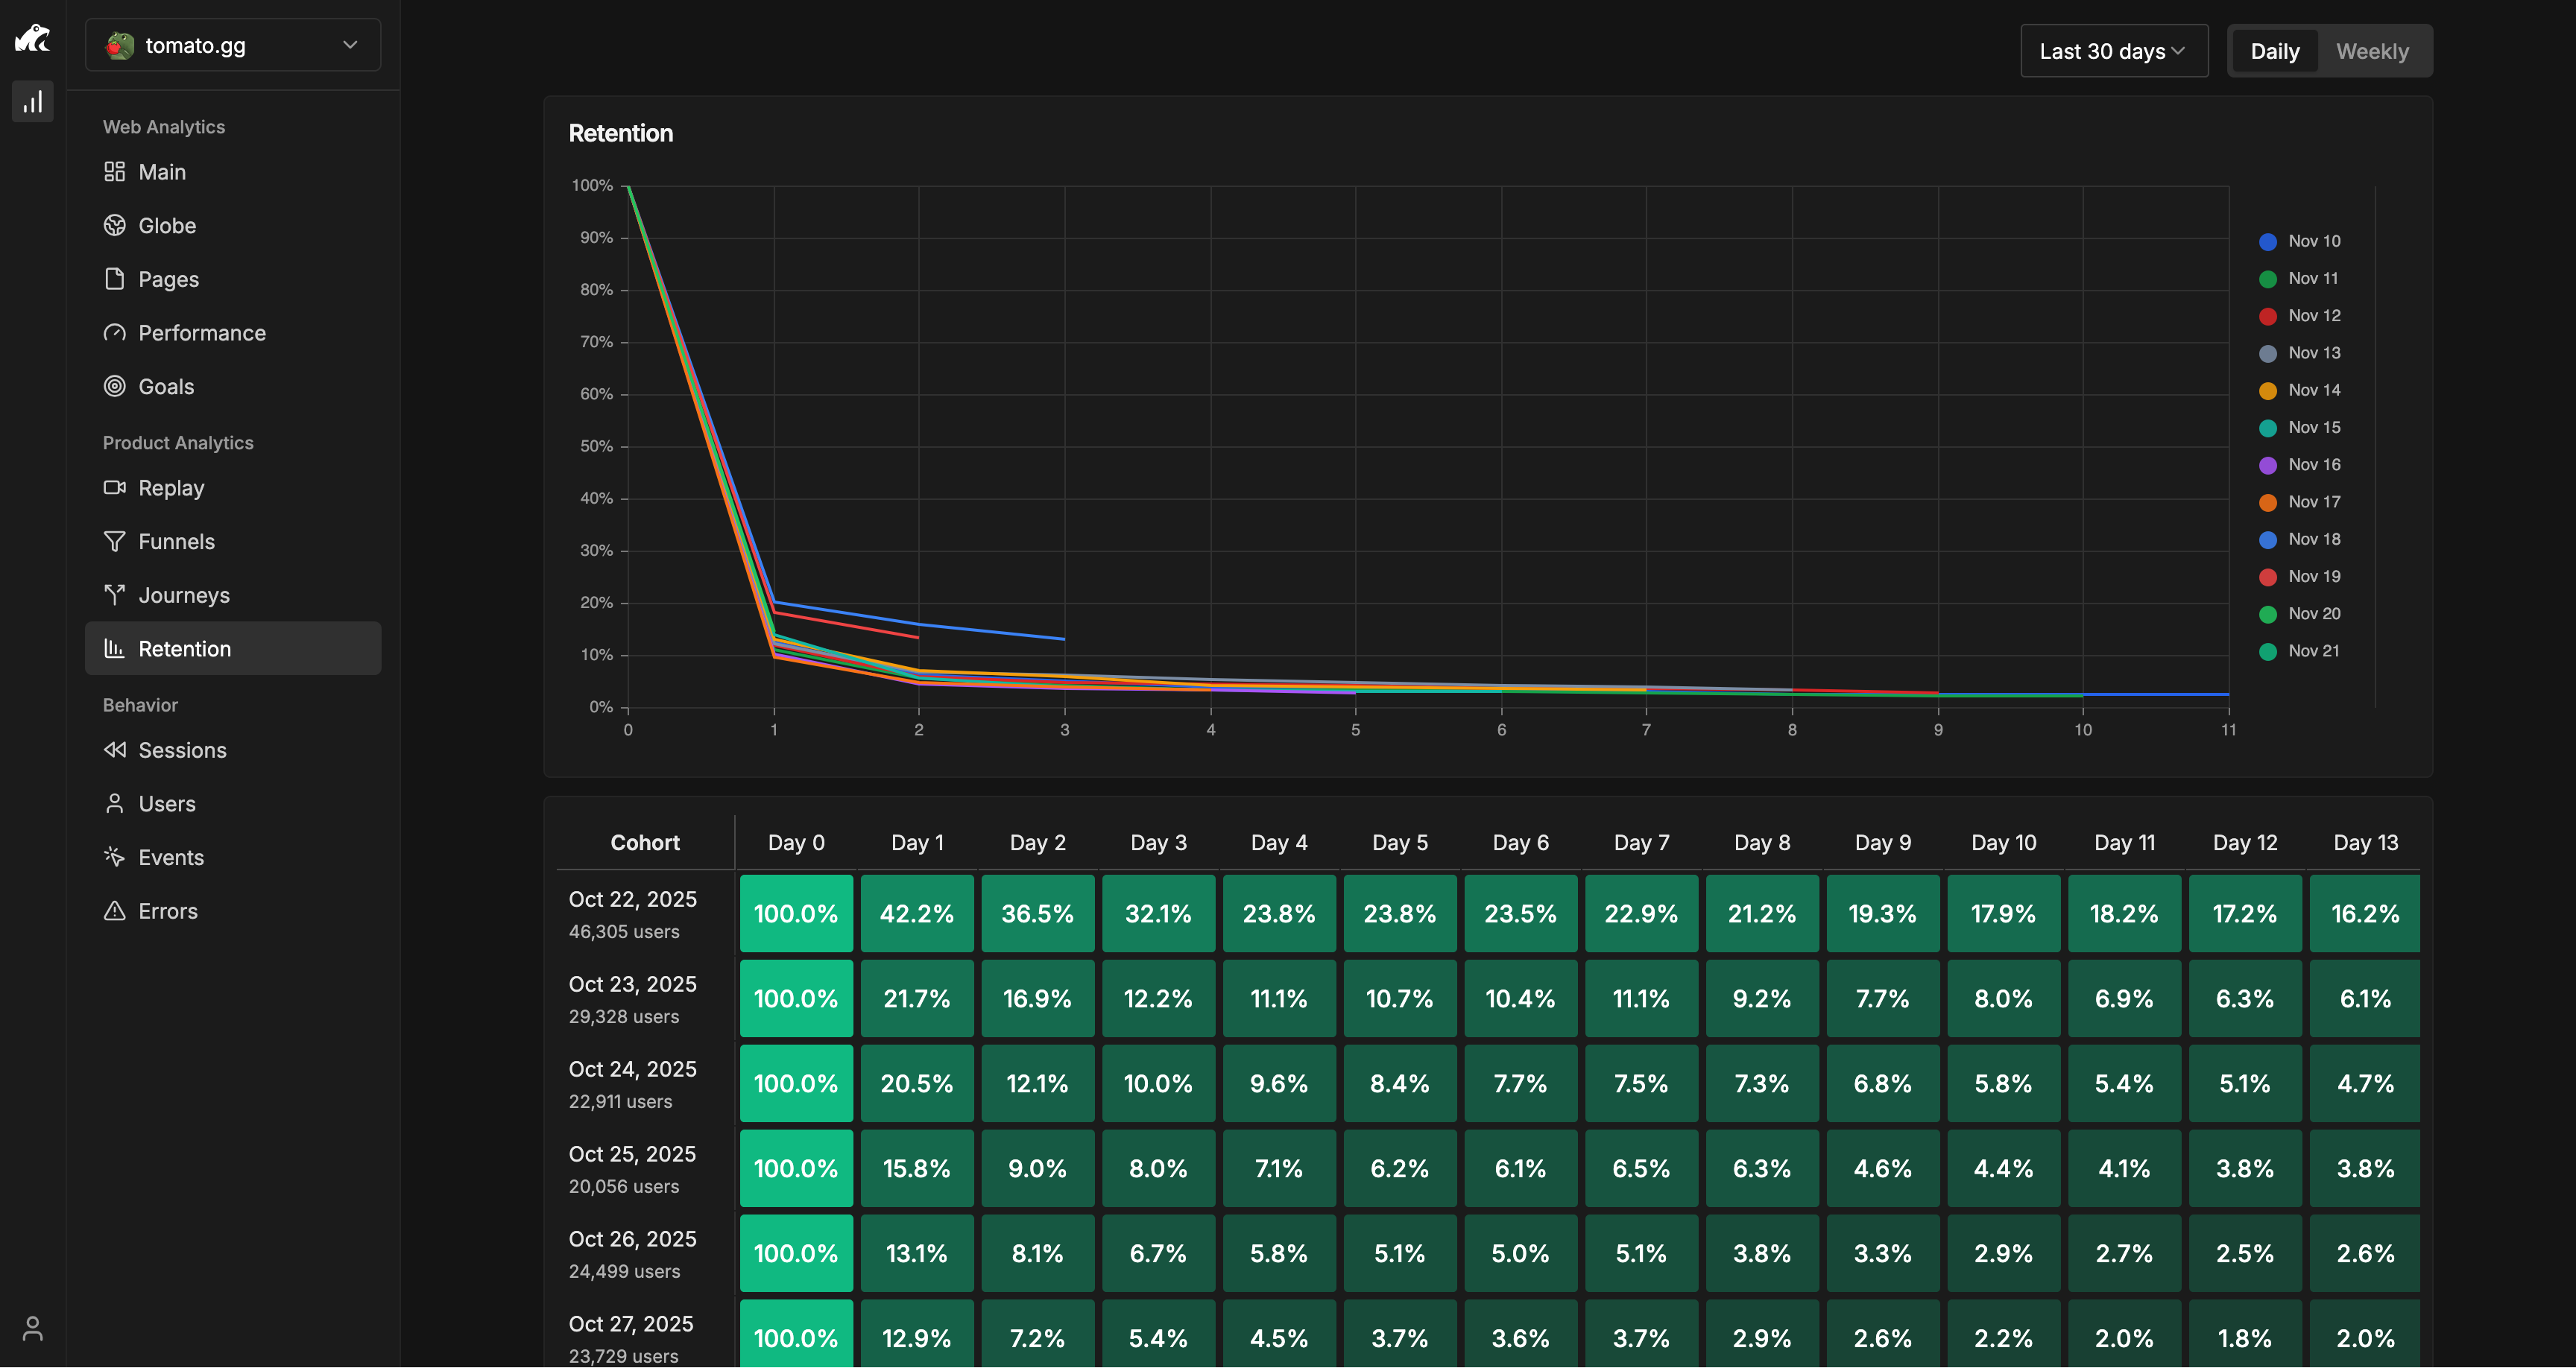
8. Retention Analysis for Growth Focus
Not all analytics tools understand retention. Rybbit's retention dashboard shows you which cohorts of users return and which don't. Segment by acquisition date, traffic source, or custom properties. See if new users from paid ads have better or worse retention than organic users.
This is how you identify growth channels that actually build sustainable businesses, not just vanity metrics.
9. Error Tracking Built-In
Website errors damage user experience and conversions. Rybbit's error tracking captures JavaScript errors and exceptions automatically. See your most common errors, affected users, and error trends over time.

GA4 requires separate error tracking. Plausible doesn't offer it. Rybbit includes it.
10. Organizations & Team Collaboration
Managing multiple sites as a team? Rybbit supports unlimited organizations, team members, and sites. Assign roles, control permissions, and collaborate effectively. Whether you're an agency managing 50 client sites or a company with multiple products, Rybbit scales.
11. Real-Time Dashboard
See activity as it happens. Launch a campaign? Watch traffic spike live. Deploy a new feature? Immediately see user interaction. A campaign is unexpectedly tanking? Spot it in seconds, not hours.
Rybbit's real-time dashboard is smooth, responsive, and genuinely useful for operational decisions.
12. Free Tier That Actually Delivers Value
GA4 is "free" but you're the product. Your data funds Google's ML engines.
Rybbit offers a free tier with full feature access. Refer to rybbit.io for current free tier details. When you grow beyond the free tier, pricing is transparent and based on your actual usage.
13. Transparent, Privacy-Respecting Pricing
Rybbit's pricing is designed to be straightforward. Refer to rybbit.io/pricing for current pricing details. Self-hosting options are also available for users who want more control over their deployment costs.
The Real-World Impact: Why This Matters
Consider a typical e-commerce or SaaS company using analytics tools. With GA4:
- You're dependent on Google's infrastructure
- You face potential GDPR compliance risks if serving EU customers
- Your data may be used for Google's AI training
- You're frustrated by complexity in the interface
- You cannot see exactly how your tracking works
With Rybbit:
- Your analytics run on your own servers—completely under your control
- GDPR compliance is built into the design
- Your customer data is yours and yours alone
- The interface shows you what matters: are users converting or not?
- You can read, audit, and modify the code yourself
- Session replay shows actual user behavior leading to concrete improvements
- You understand retention, not just vanity metrics
That freedom and clarity is valuable for growing companies.
Common Web Analytics Questions Answered
How long should I wait before analyzing data?
With Rybbit's real-time dashboard, you can see initial trends immediately. However, wait at least 2 weeks before drawing conclusions—this accounts for weekly patterns (weekends vs. weekdays). For major decisions, wait 4+ weeks of data.
What's a good bounce rate?
It depends entirely on context. A 70% bounce rate on a specific article is normal. A 70% bounce rate on your homepage suggests a problem. Compare your bounce rate to your historical average and segment by traffic source—paid traffic often has higher bounce rates than organic.
How often should I check my analytics?
Daily checks for operational monitoring (campaigns, errors) are useful. But obsessive daily metric-watching leads to premature decisions based on noise. Weekly and monthly reviews are more actionable. Quarterly reviews show true trends.
Why should I care about session duration if I have conversion data?
Session duration correlates with engagement and satisfaction. Long sessions with high conversions indicate happy, engaged customers. Short sessions with conversions might indicate urgency-driven behavior (sales pressure). Long sessions with no conversions suggests lost or confused users. Context matters.
When should I use custom events vs. goals?
Goals track high-level conversions (completed purchase, newsletter signup). Custom events capture detailed interactions (video watched, file downloaded, section scrolled). Use both: goals for business outcomes, events for understanding behavior.
Making Analytics Actionable
Having data isn't enough. Here's how to extract real value from Rybbit:
1. Define Metrics That Matter
Not everything is important. Define 3-5 key metrics directly tied to business goals:
- E-commerce: conversion rate, average order value, repeat customer rate
- SaaS: signup conversion rate, feature adoption rate, churn rate
- Media: pageviews per session, return visitor rate, premium conversion
- Nonprofits: donation conversion rate, volunteer signup rate, retention rate
2. Set Benchmarks and Watch Trends
Once you have baseline metrics, track how they change week-to-week and month-to-month. A 2% dip isn't concerning. A 20% dip warrants investigation. Trends matter more than absolute numbers.
3. Segment and Investigate
When metrics dip, use Rybbit's advanced filtering to investigate. Is conversion down across all traffic sources or just one? Is it device-specific? Did something break on mobile? Segmentation transforms "our conversions are down" into "our mobile conversions are down for Google Ads traffic from Germany"—a solvable problem.

4. Watch Session Replays
When you spot a problematic pattern in metrics, watch actual sessions. See what users do. This transforms abstract metrics into human behavior you can understand and fix.
5. Build Retention-Focused Habits
Don't optimize for vanity—optimize for sustainable growth. An acquisition channel generating lots of one-time visitors is less valuable than one generating loyal repeat users. Use Rybbit's retention analysis to identify quality traffic sources.
Conclusion: Choose Clarity Over Complexity
Web analytics is fundamentally about understanding your users and making better decisions. But the tool you choose shapes everything: your compliance obligations, your data privacy, your ability to customize, your dependency risk, and the insights you actually get.
Rybbit wins because it aligns with modern realities:
- Privacy laws (GDPR, CCPA) are real constraints, not marketing buzzwords
- Transparency is increasingly demanded by customers and regulators
- Open source communities outpace proprietary vendors in innovation
- Simplicity beats feature bloat
- Data ownership is a competitive advantage
You don't need to choose between powerful analytics and privacy-respecting practices. Rybbit proves you can have both—plus data ownership, GDPR compliance, beautiful visualizations, session replay, error tracking, and retention analysis.
Whether you're running a startup, managing a portfolio of sites, or leading analytics for an enterprise, Rybbit delivers clarity without compromise. Your analytics should serve your business and respect your users. Rybbit does both.
Ready to see the difference? Visit rybbit.com for the free tier, check out the live demo, or dive into the documentation.
Your future self—the one with better insights and fewer compliance headaches—will thank you.
Quick Reference: Rybbit vs. GA4 vs. Plausible vs. Cloudflare
| Feature | Rybbit | GA4 | Plausible | Cloudflare |
|---|---|---|---|---|
| Open Source | ✅ | ❌ | ✅ | ❌ |
| Self-Hosting | ✅ | ❌ | ⚠️ Limited | ❌ |
| Cookieless & Privacy-First | ✅ | ❌ | ✅ | ✅ |
| GDPR Compliant | ✅ | ⚠️ Debated | ✅ | ✅ |
| Session Replay | ✅ | ❌ | ❌ | ❌ |
| Advanced Filters | ✅ | ⚠️ Limited | ✅ | ❌ |
| Advanced Maps | ✅ | ❌ | ❌ | ❌ |
| User Journeys | ✅ | ✅ | ❌ | ⚠️ |
| Retention Analysis | ✅ | ✅ | ❌ | ❌ |
| Error Tracking | ✅ | ❌ | ❌ | ❌ |
| Real-Time Dashboard | ✅ | ✅ | ✅ | ✅ |
| Custom Events (JSON) | ✅ | ✅ | ⚠️ Limited | ⚠️ |
| Funnel Analysis | ✅ | ✅ | ✅ | ❌ |
| Public Dashboards | ✅ | ❌ | ✅ | ❌ |
| Transparent Pricing | ✅ | ❌ | ✅ | ✅ |
| Data Ownership | ✅ (yours) | ❌ (Google's) | ⚠️ (theirs) | ❌ (theirs) |
Notes:
- ⚠️ = Feature available with limitations, requires setup/integration, or may need paid tier
- This comparison table is accurate as of November 2025; features and availability may change in future versions. For the most current details, please refer to each product's official documentation.
- Plausible Advanced Filters: Supports multi-criteria filtering, saved segments, and subdomain/hostname filtering
- Cloudflare User Journeys: Available through Sequence Analytics feature
- Cloudflare Custom Events: Requires Zaraz integration setup (zaraz.track(), zaraz.ecommerce(), zaraz.set())
Want to learn more? Explore the Rybbit documentation, join the Discord community, or contribute to the open source project.
Related Blog Posts: