Using Rybbit Analytics to Optimize Your Content Marketing Funnel
Learn how to build, track, and optimize your content marketing funnel using Rybbit Analytics. Understand each stage of your funnel and how to measure what matters.
Using Rybbit Analytics to Optimize Your Content Marketing Funnel
Your blog gets thousands of visitors every month. Your email list is growing. You're publishing consistently.
But where's the revenue?
This is the content marketing funnel problem. Most companies create great content but fail to connect it to actual business results. They treat content like a vanity play instead of a revenue engine.
The missing piece? Understanding your content marketing funnel and measuring what happens at each stage.
In this guide, we'll walk through what a content marketing funnel is, why it matters, and how to track and optimize it using Rybbit Analytics.
What is a Content Marketing Funnel?
A content marketing funnel is the journey your audience takes from first awareness of your brand to becoming a paying customer (or taking whatever action you define as a conversion).
Unlike traditional sales funnels, which are short and focused on closing deals, content marketing funnels are longer and broader. They're designed to attract, educate, and build trust with a large audience - knowing that only a percentage will become customers.
The typical content marketing funnel has several stages:
Awareness Stage People don't know you exist. Your goal is to attract them with content that addresses their problems, answers their questions, or teaches them something valuable. Examples include blog posts, videos, podcasts, social media content, and downloadable guides.
Consideration Stage People know about you, but they're not ready to buy yet. They're comparing your solution to alternatives, learning more about your approach, and building confidence that you're the right choice. Content here might be case studies, webinars, detailed comparison guides, or in-depth product documentation.
Decision Stage People are ready to take action. Your content helps them overcome final objections and move toward a purchase or signup. Examples include pricing pages, testimonials, free trials, demos, or consultation scheduling.
Retention Stage The funnel doesn't end at purchase. You continue to serve existing customers with content that helps them succeed, increases lifetime value, and turns them into advocates who refer others.
Why Most Companies Fail at Content Marketing Funnels
Here's what happens at most companies:
They create great content. It gets traffic. They feel good about it. Then they stop analyzing.
The problems this creates:
Problem 1: No Connection Between Content and Revenue You're publishing content, but you don't know if it's actually driving customers. You might be pouring resources into content that entertains people but never converts them.
Understanding how each piece of content contributes to conversions across multiple touchpoints is called marketing attribution, and it's essential for making smart content decisions.
Problem 2: Wasted Budget on Content That Doesn't Work Without funnel visibility, you can't tell which types of content work. Do case studies drive more conversions than blog posts? Does video outperform written content? You're guessing.
Problem 3: Leaky Funnels Go Unnoticed Maybe your awareness stage is great, but nobody moves to consideration. Or you get plenty of people to consideration, but they never reach decision. These problems stay invisible without proper tracking.
Problem 4: Poor Resource Allocation If you don't know which content drives results, you can't prioritize effectively. You might spend 80% of your time on content that drives 10% of conversions while ignoring the content that drives 50% of results.
How to Structure Your Content Marketing Funnel
Before you can track and optimize your funnel, you need to structure it. This means defining the stages and metrics that matter for your business.
1. Define Your Funnel Stages
For a SaaS company, your funnel might look like:
- Awareness: Blog posts, SEO content, social media
- Consideration: Comparison guides, feature deep-dives, webinars
- Decision: Pricing page, free trial, demo request, documentation
- Retention: Onboarding guides, feature tutorials, best practices content
For an e-commerce business, it might be:
- Awareness: Trending product guides, style inspiration, educational content
- Consideration: Detailed product comparisons, sizing guides, reviews
- Decision: Product pages, customer testimonials, limited-time offers
- Retention: Care guides, styling tips, loyalty program content
2. Define Your Key Metrics
For each stage, you need to define what success looks like. Your metrics might include:
- Awareness stage: Page views, new visitors, time on page, bounce rate, scroll depth
- Consideration stage: Pages visited per session, content downloads, email signups, video views
- Decision stage: Form submissions, demo requests, pricing page views, free trial signups
- Retention stage: Return visitor rate, repeat content consumption, referral clicks
3. Set Up Tracking
This is where Rybbit comes in. You'll set up events and goals to track what you care about at each funnel stage. The key is to track actions that matter, not vanity metrics.
Tracking Your Content Marketing Funnel with Rybbit
Rybbit provides multiple ways to track your content marketing funnel. Here's how to leverage them:
Setting Up Goals for Key Actions
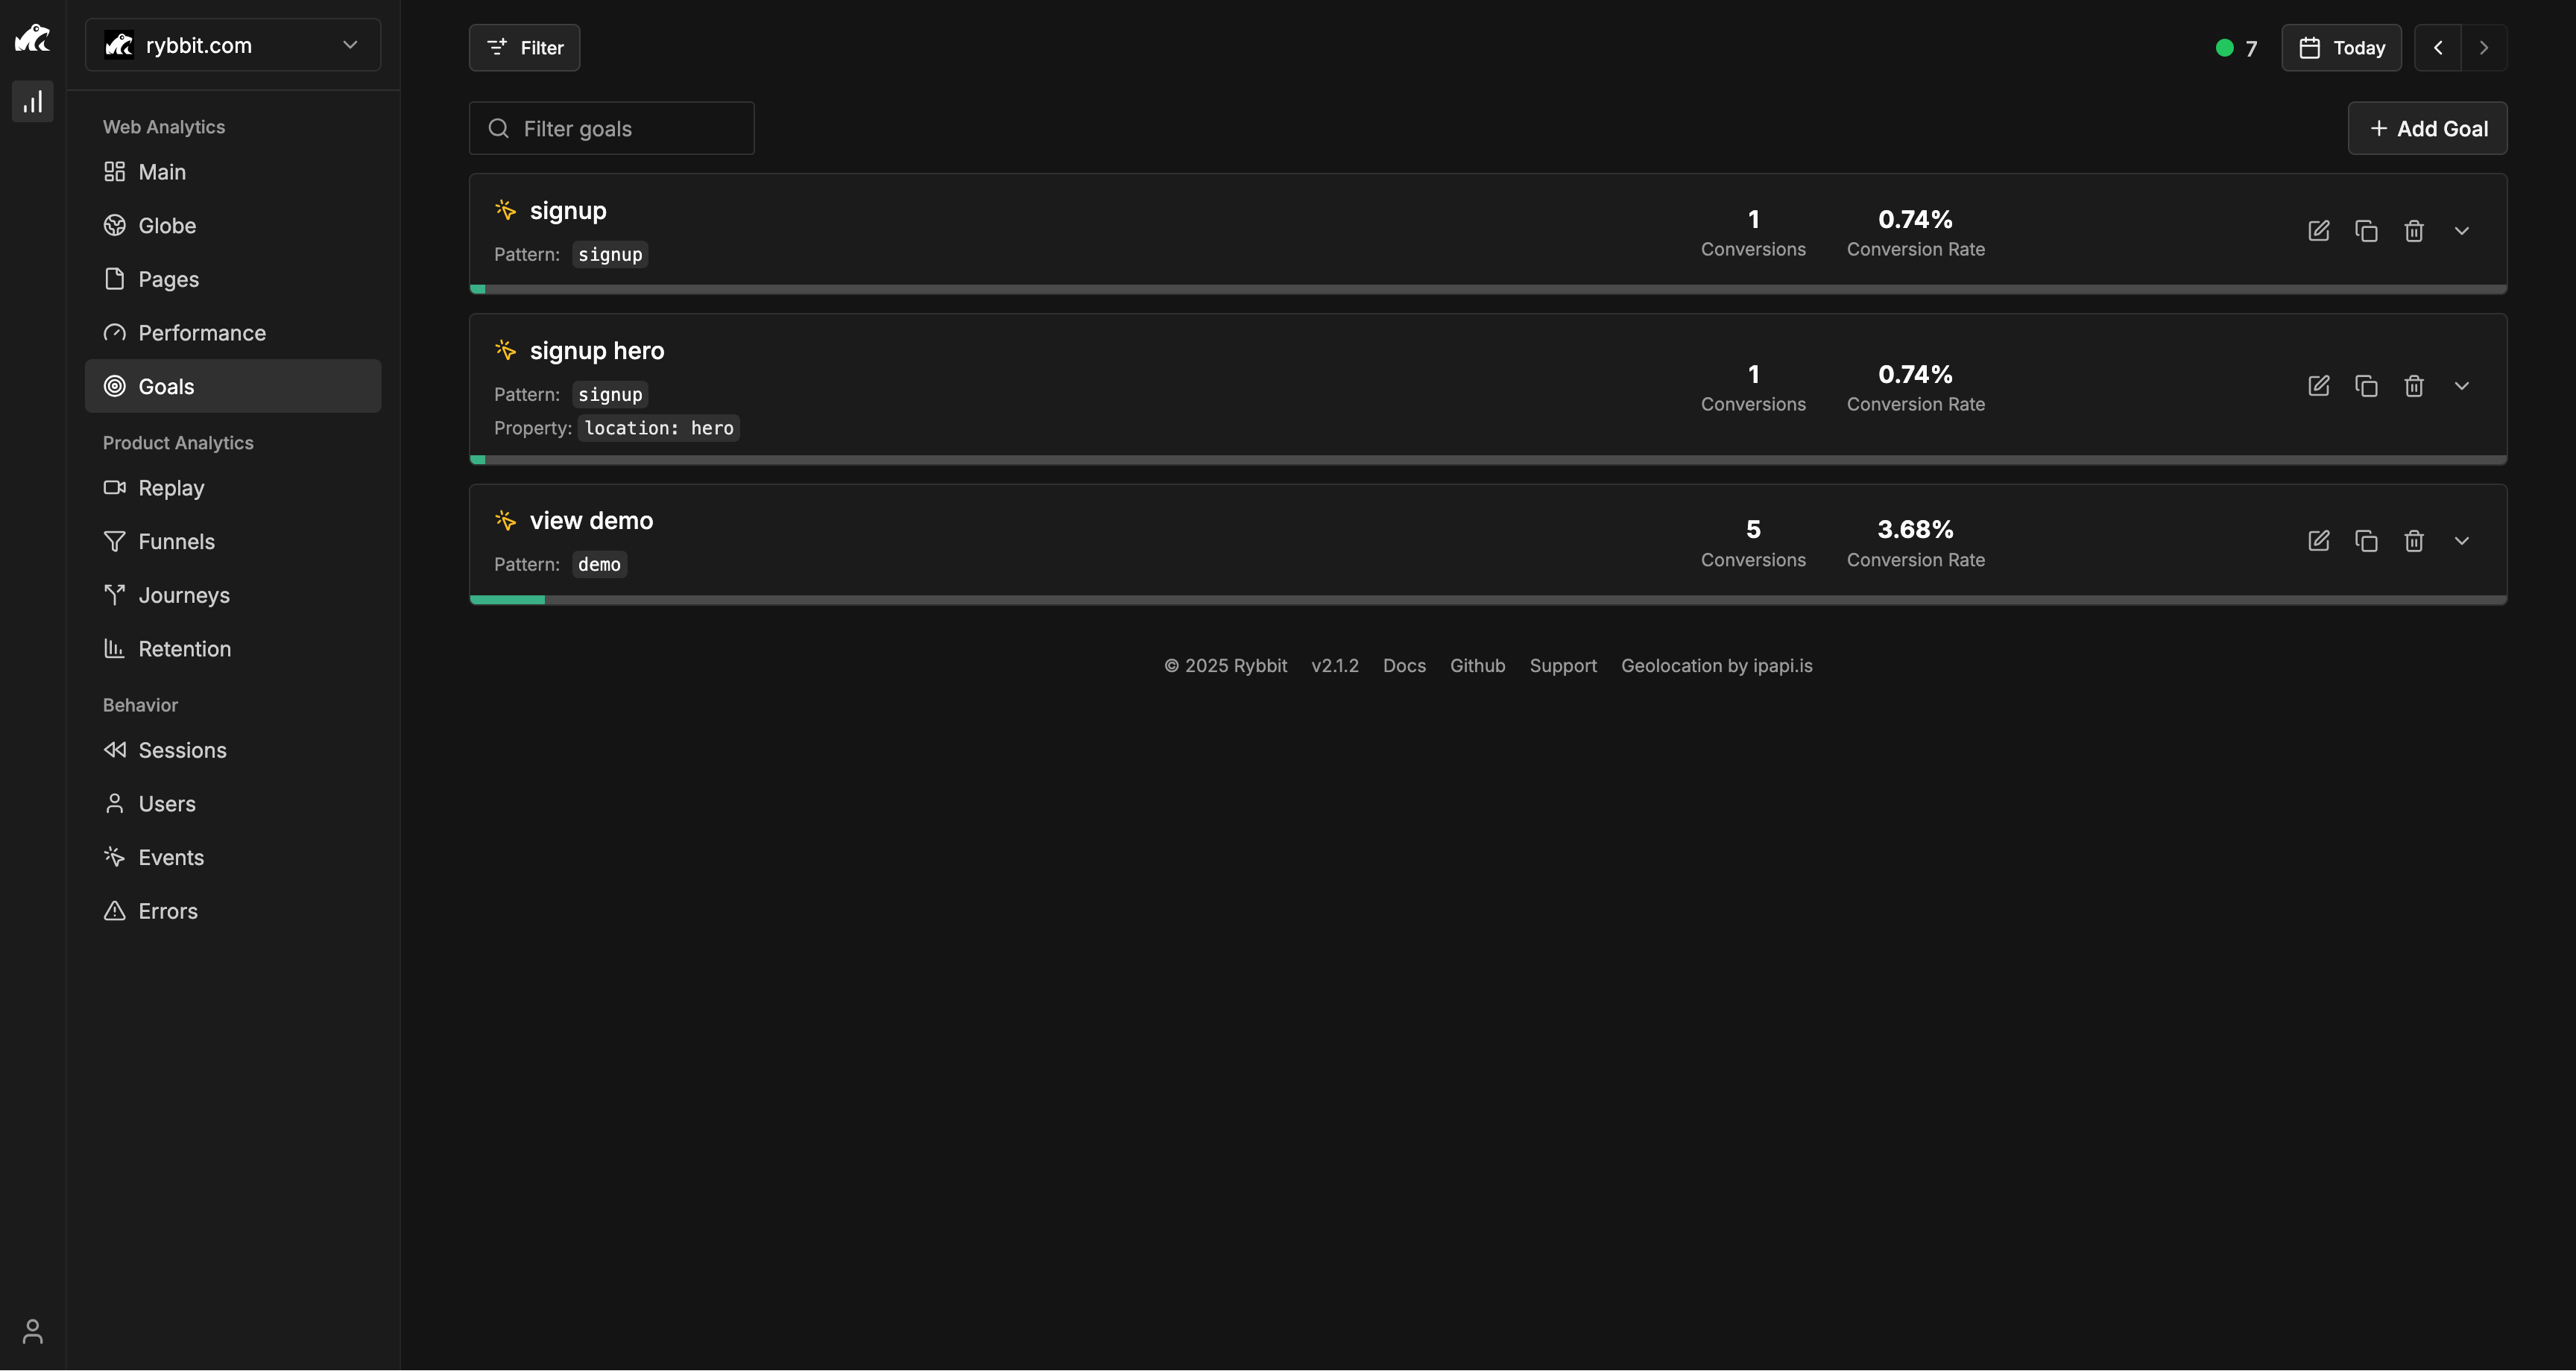
Rybbit's Goals feature lets you track important conversions. You create goals by defining either page paths or custom events. For content marketing, you might create goals for:
- Email signups (track the thank-you page URL after form submission)
- PDF downloads (track the download confirmation page)
- Demo requests (track the submission confirmation page)
- Free trial signups (track the welcome or onboarding page)
- Contact form submissions (track the success page)
When setting up a goal, you can optionally assign a monetary value to conversions. This helps you understand the economic impact of your content. Once created, each goal shows:
- Conversion count (total times the goal converted)
- Conversion rate (percentage of sessions that converted)
- Total value (sum of all conversion values, if assigned)
- Trend indicator (compared to previous period)
- Performance by traffic source
- Performance by device type
Tracking Custom Events with JSON Properties
Beyond page views, track specific user actions that indicate content engagement. Rybbit lets you track custom events with properties, answering detailed questions about user behavior.
You can track events using:
- Data attributes on HTML elements (no JavaScript required):
<button data-rybbit-event="signup_clicked">Sign Up</button> - JavaScript API for more control:
window.rybbit.event("Video Watched", { videoTitle: "Content Funnel Guide" })
Common events for content marketing:
- Video plays with video title as a property
- Content downloads with content type as a property
- Form submissions with form name as a property
- Button clicks with button labels
- Scroll depth milestones
- Content engagement time thresholds
Events are tracked in the Behavior Analytics section and can be used as goals or for filtering.
Segmenting with Advanced Filters
Rybbit's filtering panel lets you combine 15+ dimensions to create specific segments. You can filter by:
- Page path (to analyze specific blog posts, landing pages, or content pieces)
- Referral source (direct, organic search, social media, email, paid campaigns)
- Device type (mobile, tablet, desktop - see if content performs differently across devices)
- Browser and OS
- Country and city (identify high-performing markets)
- Screen resolution
- UTM parameters (utm_source, utm_medium, utm_campaign, utm_term, utm_content)
- Custom event properties


This filtering power lets you answer questions like:
- "Which blog posts drive the most demo requests?"
- "Do people from organic search visit consideration content more often than people from social?"
- "Is mobile traffic converting to email signups at a lower rate than desktop?"
- "Which geographic regions show the highest content engagement?"
You can combine multiple filters to create sophisticated segments. For example: "Mobile users from organic search who watched our product video" or "Returning visitors from email campaigns who viewed pricing pages."
Using Journeys to Understand Content Paths
Rybbit's Journeys feature visualizes the actual paths users take through your content before converting. This reveals:
- Which content pages users visit before taking action
- The sequence of content that leads to conversions
- Where users backtrack or get confused
- Alternative routes users take to reach goals
- Drop-off points in content journeys
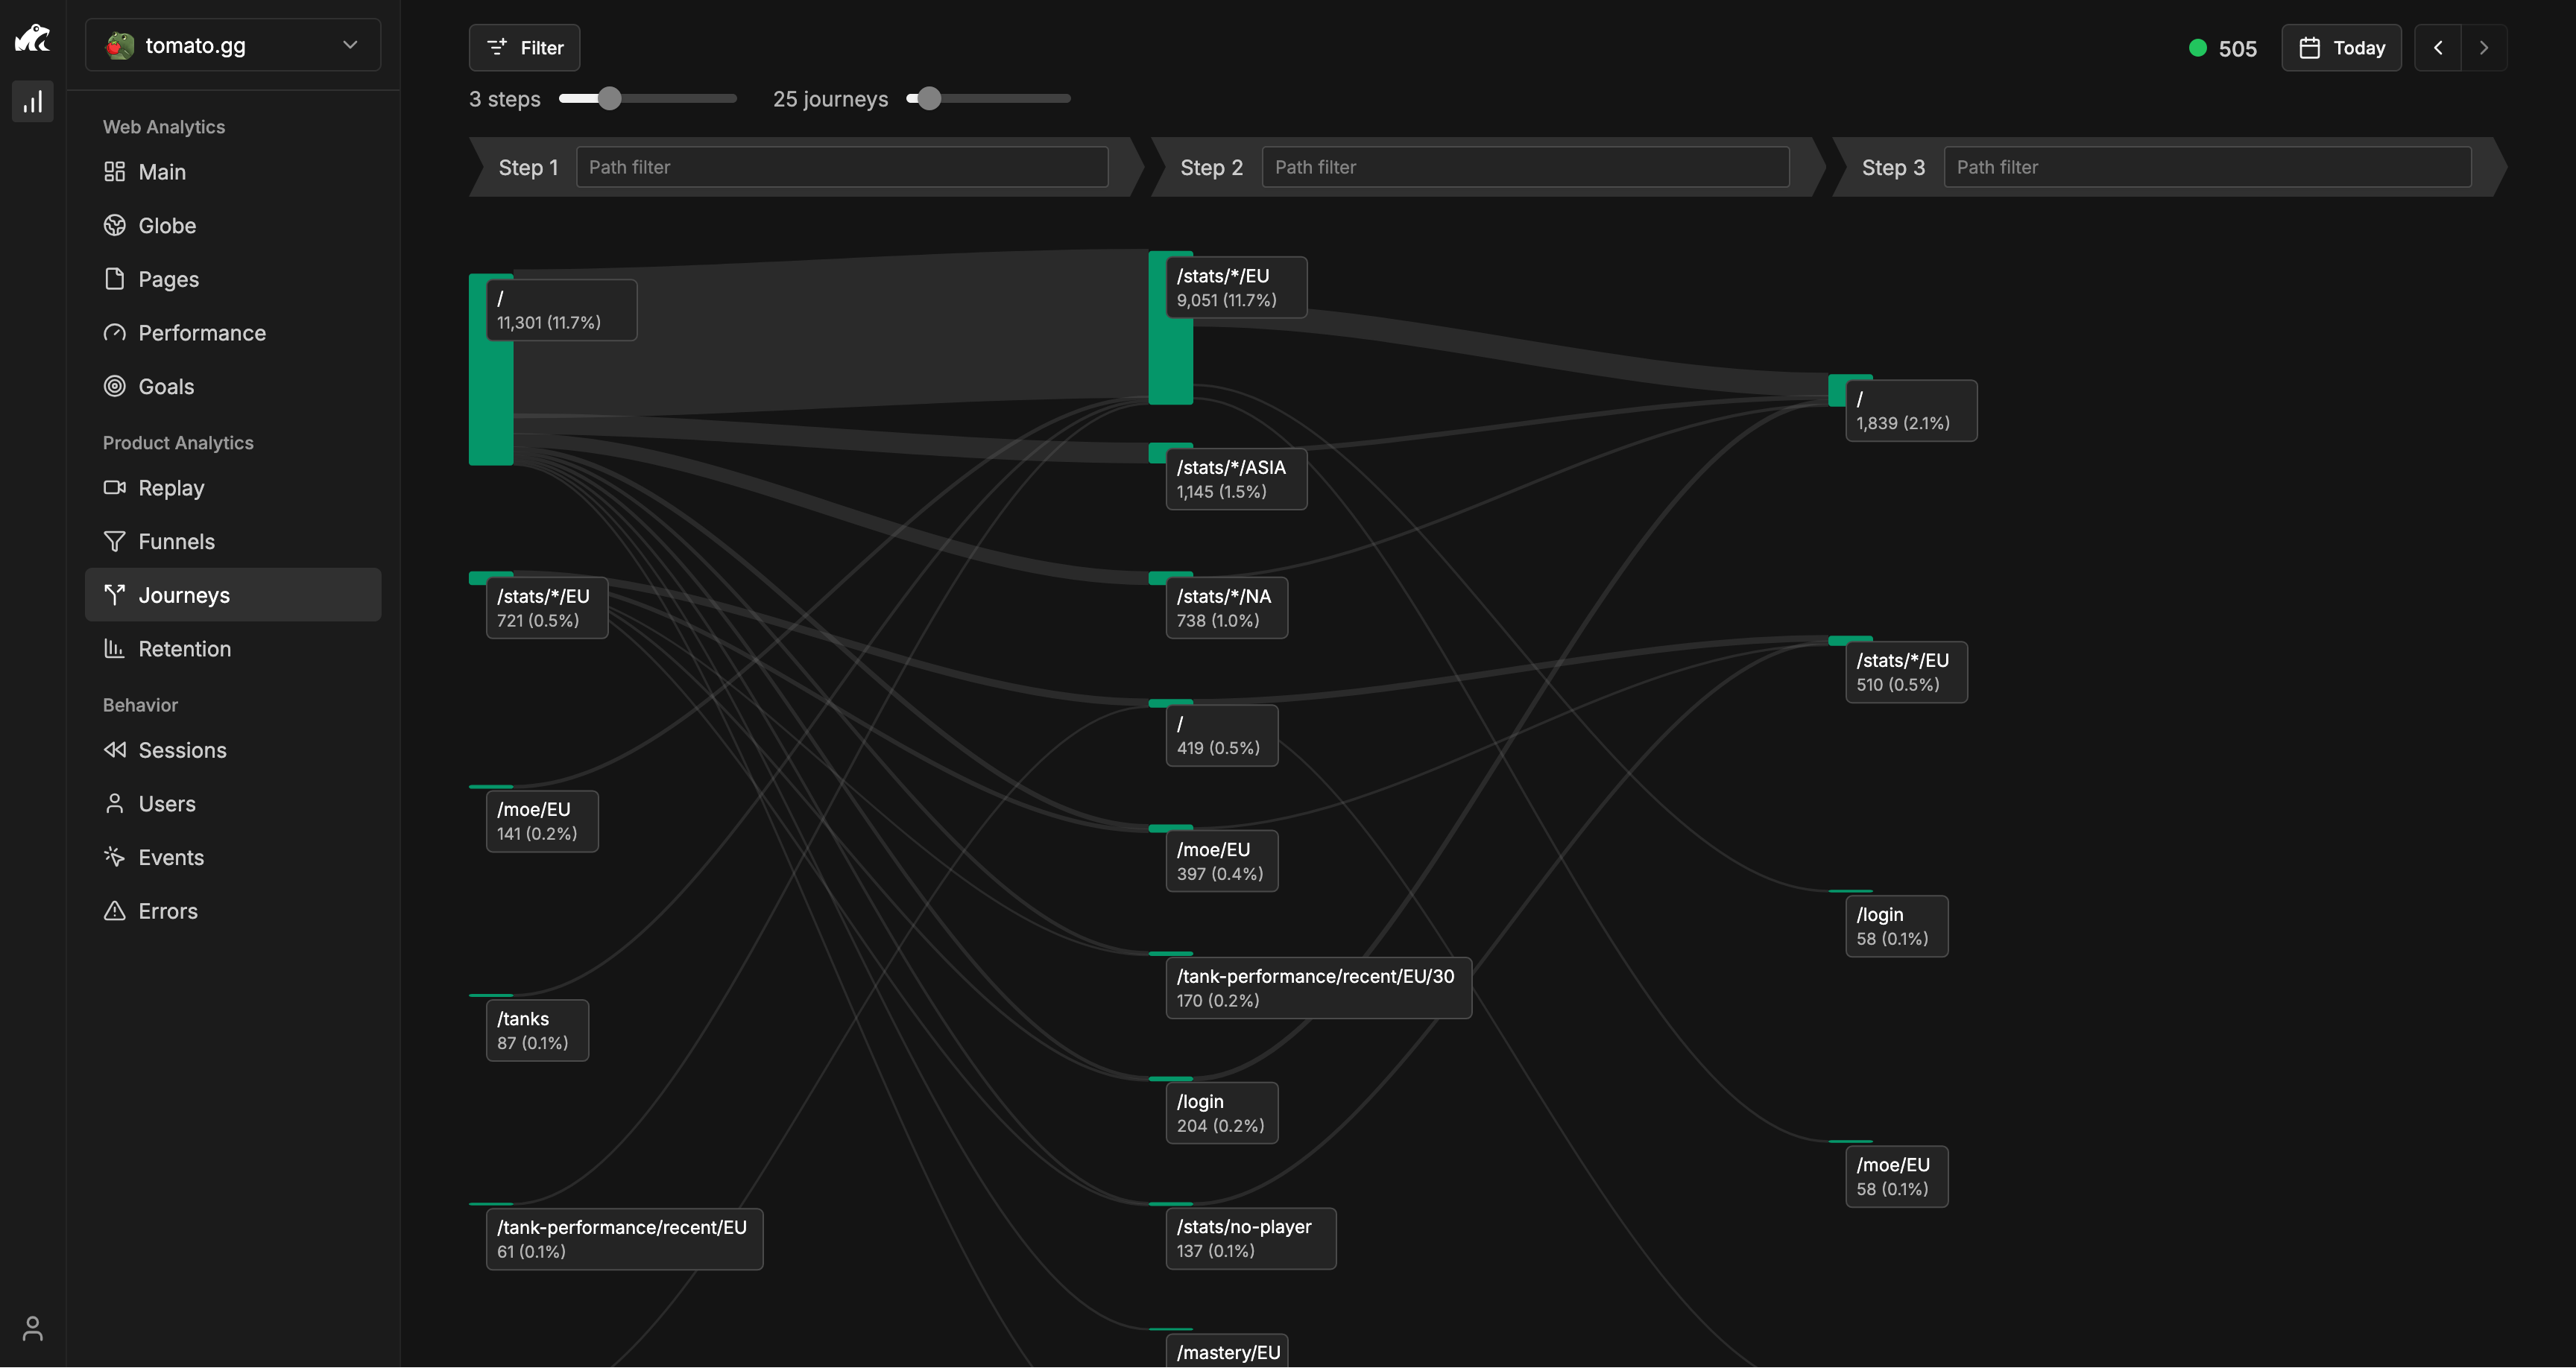
Start your journey from an entry point (like a blog post) to see where readers go next, or work backward from a conversion goal to see which content sequences lead to conversions. This helps you understand which content pieces are most valuable and how to structure internal linking for better funnel flow.
Funnels for Multi-Step Conversions
For complex content marketing flows, use Rybbit's Funnel feature to track multiple steps. Define your funnel steps as:
- Content discovery (visit to blog/awareness content)
- Content engagement (read 2+ minutes on page or click related articles)
- Consideration content (visit comparison guide, webinar signup, or email capture)
- Decision content (view pricing page, schedule demo, or complete signup)
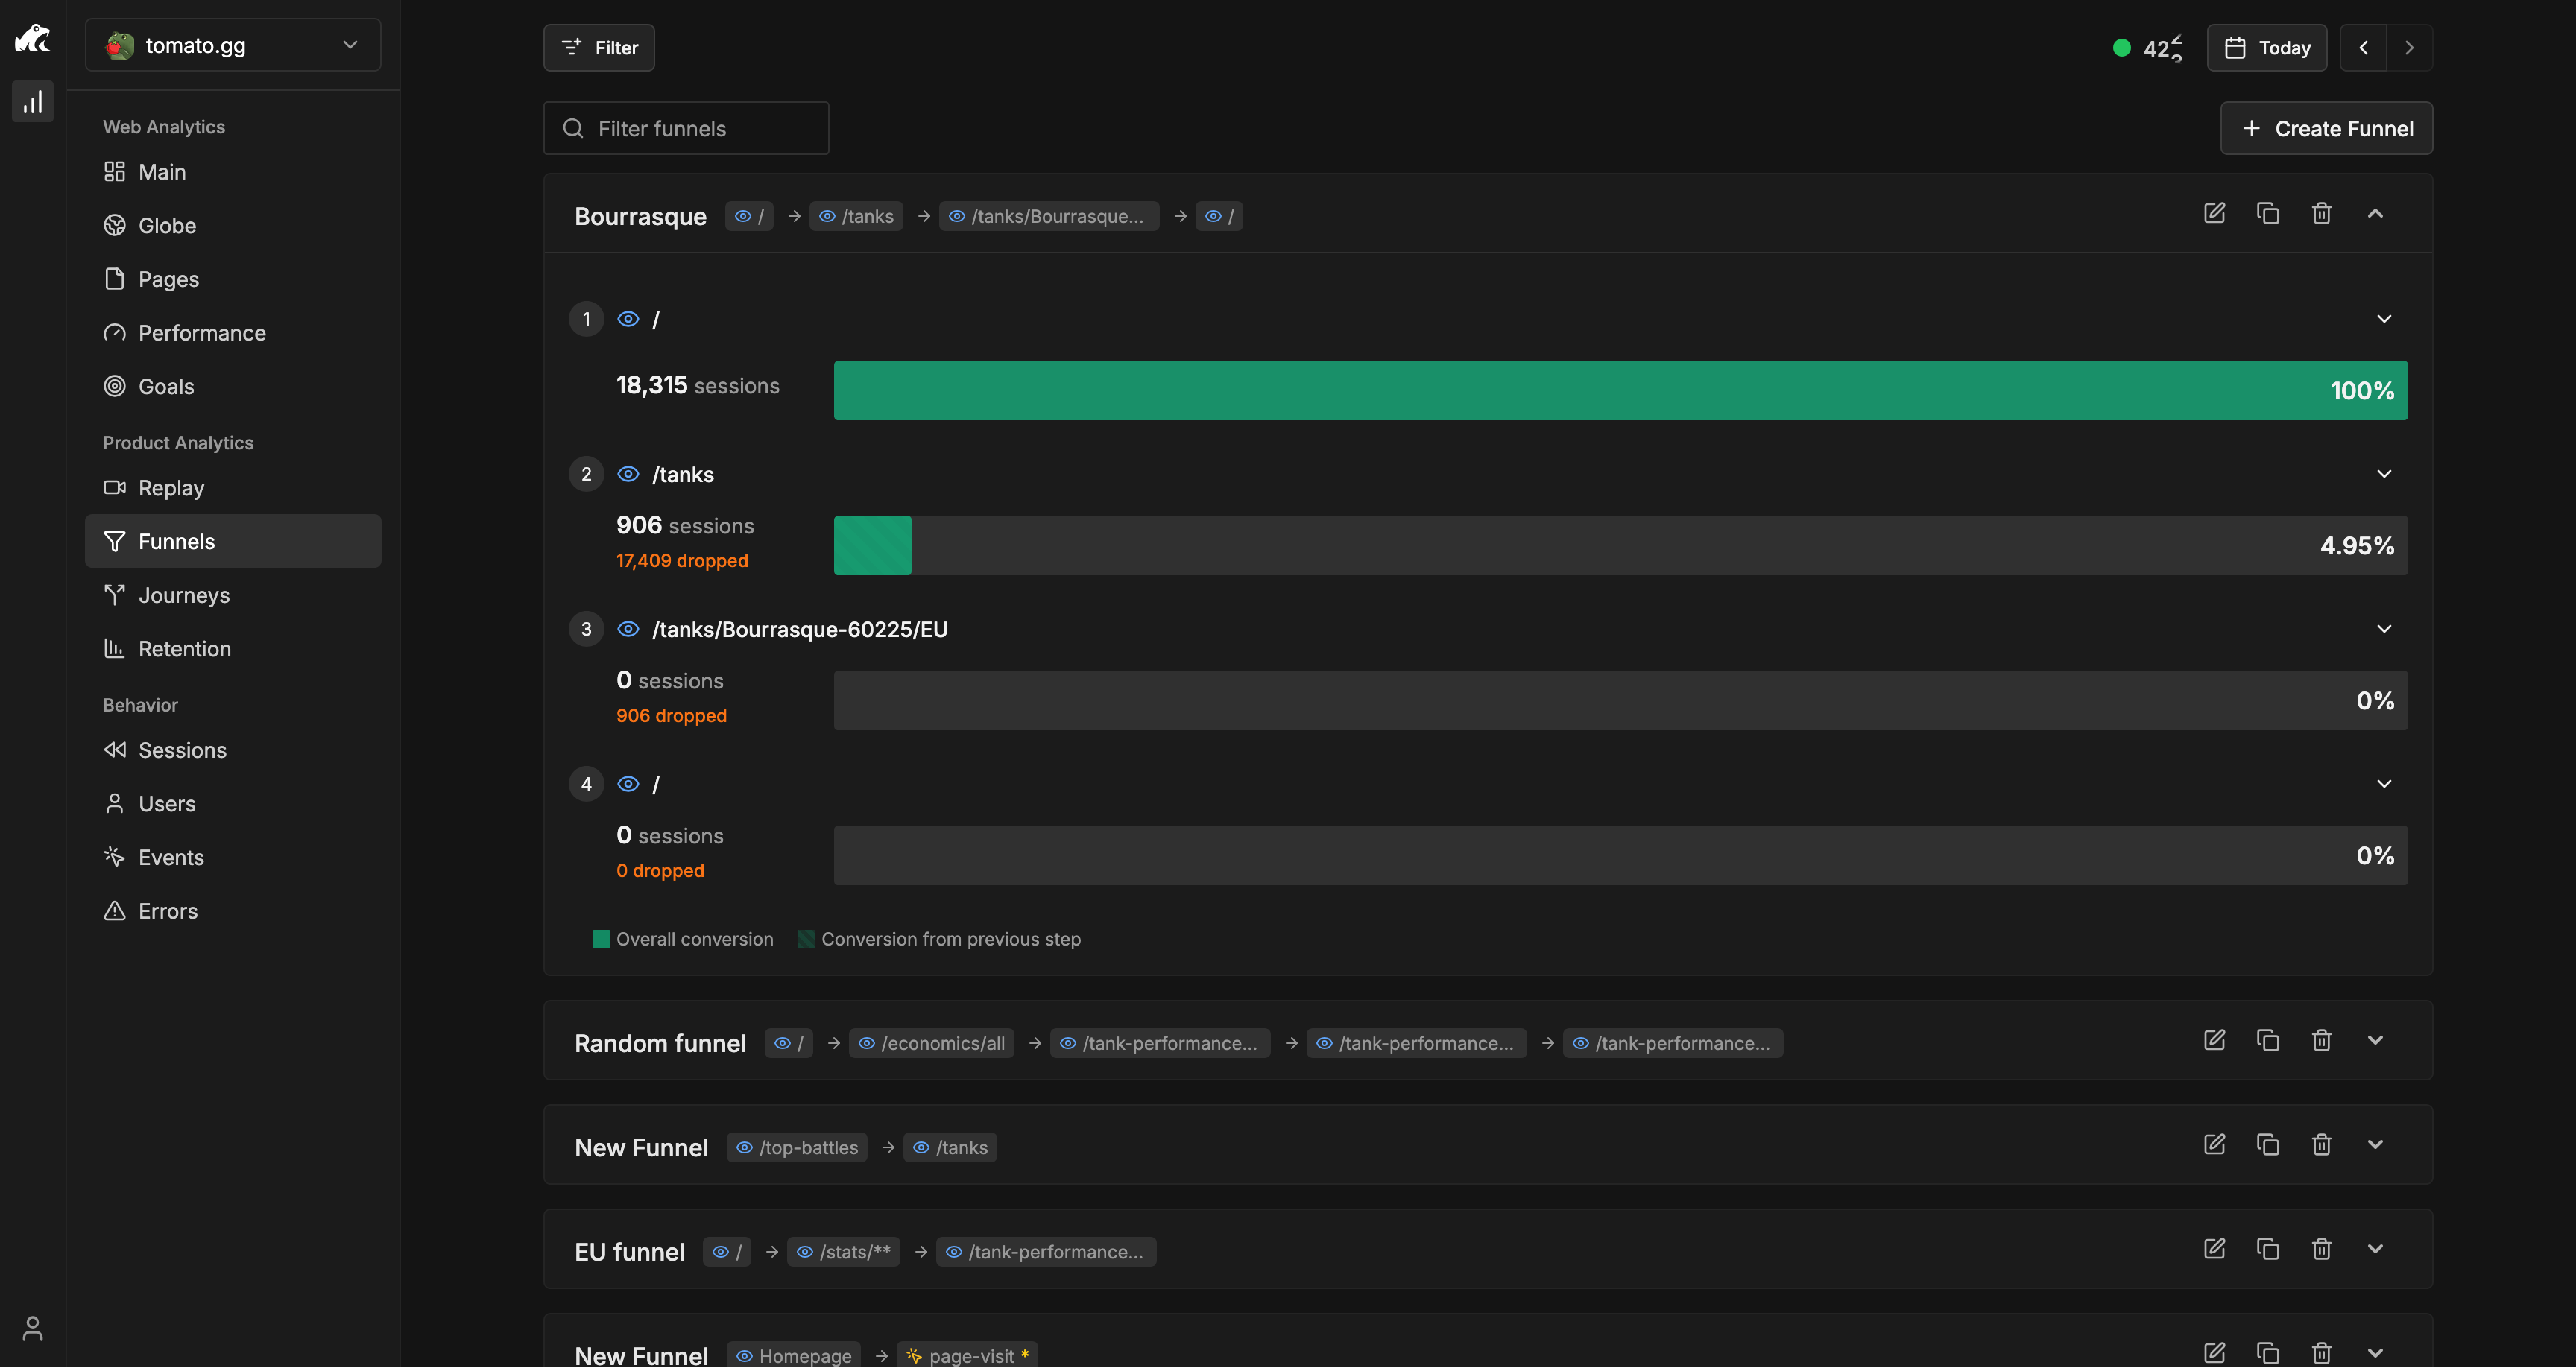
The funnel shows conversion rates between each step and identifies exactly where people drop off. You can see which step has the biggest leak and needs optimization. For example, if 1,000 people read awareness content but only 100 visit consideration content, your leak is at the awareness-to-consideration transition.
Funnels can work within a single session or across multiple days, depending on your content marketing cycle. A quick decision-stage funnel might complete in one session, while a full awareness-to-purchase funnel might take weeks.
Analyzing Your Funnel: Key Questions to Answer
Once you've set up tracking, here are the questions you should be asking:
1. How Many People Are At Each Stage?
Use Rybbit's Funnel feature to see exactly how many users reach each stage. For example:
- How many unique visitors reached awareness content (e.g., viewed blog posts)?
- How many of those progressed to consideration content (e.g., viewed comparison guides)?
- How many converted to decision actions (e.g., submitted demo request)?
Rybbit's funnel visualization immediately shows you the absolute numbers and percentages at each step. A healthy funnel gradually narrows - you should have fewer people at each subsequent stage. If 10,000 users view awareness content but only 100 request a demo, your overall funnel conversion is 1%.
The funnel also shows "drop-off rate" - the percentage of users who abandon at each step. This metric highlights exactly where you're losing the most people.
2. What's Your Conversion Rate Between Stages?
Rybbit's Funnel feature automatically calculates conversion rates between steps. For example, if 1,000 users viewed your awareness content and 300 moved to consideration content, your awareness-to-consideration conversion rate is 30%.
The Funnel tab also shows your overall conversion rate - the percentage of users who completed the entire journey from start to finish. If only 1% of users who view awareness content eventually request a demo, that overall rate becomes your key metric to improve.
Rybbit breaks down funnel performance by:
- Traffic source (organic search, email, paid ads, social, direct, referral)
- Device type (mobile, tablet, desktop)
- Time period (daily, weekly, monthly)
These breakdowns reveal that certain channels convert better through your funnel. You'll see which channels drive the best results at each stage.
3. Which Content Drives the Most Conversions?
Use Rybbit's Journeys feature to see which specific content pages appear most frequently in successful conversion paths. Or use filters on your Goals to see which blog posts drive the most email signups.
You can also use Rybbit's Pages section to analyze specific content performance:
- Page views on each content piece
- Unique visitors per page
- Average time on page
- Bounce rate for that specific content
- Traffic sources that found that content

Click any page to filter your entire view - now all metrics show only sessions that included that page. This reveals whether readers of a specific blog post convert at higher rates than average.
Questions to answer:
- Which blog posts drive readers to visit comparison guides?
- Which content pieces appear most in paths leading to demo requests?
- Which content types convert best (video vs written, long-form vs short)?
4. What's the Drop-Off Point?
Rybbit's Funnel feature visually highlights your biggest drop-offs. Look for steps where a significant percentage of users abandon the process before proceeding. This could indicate:
- Confusing or unclear content
- Missing calls-to-action or next steps
- Technical issues or slow page loading
- Content that doesn't match visitor expectations
- Forms requesting too much information too soon
Once you identify the biggest leak, investigate that specific step. Check the content quality, calls-to-action, page speed, and mobile experience. Use Rybbit's Session Replay feature to watch actual users interact with problematic pages.
5. How Do Different Channels Perform Through the Funnel?
Rybbit's Funnel feature breaks down conversion rates by traffic source. Look at your data to understand:
- Which traffic sources drive awareness-stage engagement
- Which sources progress well to consideration stage
- Which sources complete the entire funnel
- How funnel completion rates differ across channels
Use Rybbit's channel filters in combination with your funnel analysis to understand these differences. This guides where to invest your marketing budget and what type of content to promote through each channel.
6. What's the Content Path to Conversion?
Rybbit's Journeys feature visualizes the actual sequences of content that lead to conversions. Instead of guessing at your "ideal" content path, you see the real paths your customers take.
Work backward from your conversion goal (like a demo request) to see: "What content do successful users typically view before converting?" You might discover patterns in the sequence of content that your best converters consume.
This tells you which content pieces are most valuable and how to sequence them. Use these insights to improve internal linking, create content bundles, or adjust your email sequences to guide people along successful paths.
Optimization Strategies Based on Funnel Insights
Once you're measuring your funnel, you can optimize it systematically:
Optimize Your Awareness Stage
If you notice low awareness-to-consideration conversion, use Rybbit's data to diagnose:
Check bounce rate: Use the Pages section to see bounce rate on awareness content. If bounce rate is abnormally high compared to your other content, the content might not be matching visitor expectations. This could mean:
- Landing page headlines don't match the search query or traffic source
- Page content is unclear or poorly structured
- Mobile experience is broken
- Load times are slow (check Performance tab)
Look at scroll depth: Use custom event tracking to measure how far readers scroll. If scroll depth metrics are lower than your other content, readers might not be finding value. Consider:
- Simplifying introduction paragraphs
- Adding subheadings to break up content
- Moving key points higher on the page
Analyze traffic source mismatches: Filter your awareness content by traffic source. If different traffic sources show significantly different bounce rates, you might be attracting different audience types through different channels. Adjust your promotion strategy or content type accordingly.
Improve internal linking: Look at your Journeys to see which awareness content leads to consideration content. Add internal links from high-traffic awareness pieces to relevant consideration content. Make CTAs clear and compelling.
Optimize Your Consideration Stage
If you have low consideration-to-decision conversion, use Rybbit to investigate:
Identify engagement: Use custom event tracking to measure time spent, scroll depth, and video completion on consideration content. If users are spending significant time on a page but not converting, the content is engaging but the conversion mechanism might be weak.
Test calls-to-action: Track CTA clicks as a custom event. If CTAs are rarely clicked, make them more prominent, clear, and compelling. Test different value propositions.
Check device-specific performance: Use the Goals tab to see conversion rates by device. If desktop and mobile show significantly different conversion rates, your mobile experience may need optimization. Make sure forms are mobile-optimized with minimal fields.
Segment by source: Filter consideration conversion rates by traffic source. If different sources show different conversion rates, it tells you these audiences have different levels of engagement and may need different messaging.
Look at journey patterns: Use Journeys to see what content sequence typically leads to conversions. Are successful users visiting multiple comparison articles before deciding? Create an internal linking strategy that guides users through this optimal path.
Optimize Your Decision Stage
If people reach decision content but don't convert, investigate:
Analyze form abandonment: If you have a demo request form, track "form started" as an event and "form submitted" as a goal. The gap between these tells you drop-off during form completion. If many start but few finish:
- Reduce form fields
- Use progressive profiling (ask fewer questions upfront)
- Remove optional fields
- Make form copy clearer
After making changes, test your improvements using multivariate testing to see which variations work best.
Check by device and geography: If decision conversion is low on mobile, optimize for mobile (larger buttons, simplified forms, faster loading). If conversion varies by country, consider localization (currency, language, local payment methods).
Reduce decision anxiety: If people view decision content but don't convert, create additional reassurance:
- Add money-back guarantees
- Show customer testimonials and social proof
- Include security badges and certifications
- Add FAQ sections addressing common objections
- Make privacy policies and terms clear
Review content timing: Use time-to-conversion metrics to see if users need more time between consideration and decision. If most conversions happen after multiple visits, add email nurture sequences or retargeting content.
Optimize Channel Performance
Use Rybbit's Goals breakdown by traffic source to see which channels have the best funnel performance. In your data, look for patterns such as:
Organic search: Analyze how organic traffic moves through each funnel stage. Based on what you find, create more of the content types that are converting.
Email: Track how email-driven traffic performs through your funnel. Use your data to test different email sequences and see which drive the best conversions.
Paid advertising: Monitor whether paid traffic has different funnel performance at different stages. Adjust your paid strategy based on where conversion drops occur.
Social media: Analyze social traffic patterns through your funnel. Optimize your social-driven content and CTAs based on where you see drop-offs.
Referral traffic: Track referral traffic performance. Identify which sources drive the best-converting traffic and strengthen those relationships.
Building Your Content Marketing Funnel Tracking
Here's how to get started with Rybbit for your content funnel:
Step 1: Map Your Funnel Stages and Define Success Metrics
Define what content belongs in each stage of your funnel. Then identify the specific pages or actions that indicate progression through each stage.
Step 2: Create Goals for Each Key Conversion
For each conversion action, create a goal in Rybbit. Use page path goals for pages like thank-you pages, confirmation pages, or success pages. Use event goals for actions like button clicks or form submissions that don't result in page navigation.
Assign monetary values to goals where possible. The value you assign should reflect the economic worth of that conversion to your business.
Step 3: Set Up Custom Event Tracking
Implement event tracking for engagement indicators at each funnel stage. Use the Rybbit JavaScript API or data attributes to track:
- Video plays with video titles or IDs
- Read time milestones at intervals you define
- Button clicks using data attributes on CTAs
- Content downloads when PDFs or resources are accessed
- Form interactions like form starts and completions
Step 4: Create Funnel Definitions
Define your multi-step funnels in Rybbit's Funnel feature. Include:
- 3-5 key milestones (start simple, expand later)
- Clear names for each step
- Page paths or events that define each step
- Decision on session-based vs. multi-day tracking (use multi-day if your content cycle takes days or weeks)
Step 5: Apply Filters for Segmentation
Create filtered views for different audience segments. For example:
- Organic search traffic only
- Mobile users
- First-time visitors
- Users from specific geographic regions
- Users from specific traffic campaigns
Compare how each segment progresses through your funnel. This reveals which segments need different content or optimization strategies.
Step 6: Monitor and Analyze Weekly
Create a weekly review habit. Check:
- Overall funnel conversion rates
- Conversion rates by traffic source
- Drop-off rates at each step
- Top pages and content driving each step
- Journey patterns (work backward from conversions to see typical paths)
Set a baseline and track trends. Are conversion rates improving? Getting worse? Staying flat?
Step 7: Test and Iterate Based on Data
Based on your Rybbit insights, make targeted improvements:
- Add CTAs to high-traffic content that has low progression rates
- Create transition content that bridges drops between stages
- Link to high-converting content from similar pieces
- Test different email sequences for different segments
- Optimize mobile experience if mobile users drop off more
After implementing changes, monitor the funnel again. Did your conversion rate improve? By how much? What was the revenue impact?
Common Content Marketing Funnel Metrics to Track in Rybbit
Here are the key metrics to monitor at each funnel stage:
Awareness Stage Metrics:
- Total pageviews on awareness content (blog posts, guides, educational content)
- Unique users who viewed awareness content
- Bounce rate on awareness content (high bounce might mean content doesn't match visitor expectations)
- Average time on page (indicates engagement level)
- Sessions per user (are people returning to read more awareness content?)
- Traffic source breakdown (where are awareness readers coming from?)
Consideration Stage Metrics:
- Unique users who viewed both awareness AND consideration content (progression rate)
- Email signup conversion rate (percentage of consideration visitors who signup for more info)
- Content download rate (percentage downloading guides, case studies, or resources)
- Pages per session for consideration stage (are they exploring multiple pieces?)
- Average time spent in consideration stage
- Device type split (do mobile users engage differently with consideration content?)
Decision Stage Metrics:
- Demo request form submission rate
- Free trial signup conversion rate
- Contact form submission rate
- Pricing page view rate (percentage of consideration readers who view pricing)
- Add-to-cart rate (for e-commerce content funnels)
- Session duration before conversion (how long do users spend before deciding?)
Overall Funnel Health Metrics:
- Top-to-bottom conversion rate (awareness visitors to paying customers or qualified leads)
- Stage-to-stage drop-off rates (where are you losing the most people?)
- Average time to conversion (how long is your sales cycle?)
- Conversion rate by traffic source (which channels produce best customers?)
- Conversion rate by device (mobile vs desktop performance)
- Conversion rate by geographic region
Engagement Quality Metrics:
- Scroll depth on awareness content (are people reading the whole article?)
- Video play rate and completion rate
- Number of internal links clicked
- Related content clicks
- Return visitor rate to consideration content (are people coming back?)
You can view these metrics using:
- Main tab: See overall traffic, bounce rate, pages per session, session duration
- Pages section: Individual page performance and bounce rates
- Goals tab: Conversion counts, rates, and performance by source/device
- Funnels: Stage-by-stage conversion rates and drop-off percentages
- Journeys: Actual user paths and which content sequences lead to conversions
- Behavior Analytics: Custom events showing specific engagement actions
- Filters: Segment all metrics by source, device, location, or custom properties
Avoiding Content Funnel Mistakes
As you build out your content marketing funnel tracking, avoid these common mistakes:
Mistake 1: Tracking Vanity Metrics Don't get distracted by metrics that feel good but don't drive business results. Page views and social media impressions don't matter if they don't move people through your funnel.
Mistake 2: Not Tracking Conversion Actions If you only track page views, you're missing the picture. You need to know which content actually drives conversions.
Mistake 3: Ignoring the Middle of the Funnel Many companies obsess over awareness and decision stages but ignore consideration. But consideration is where trust is built and objections are overcome. Don't neglect it.
Mistake 4: Expecting Immediate Results Content marketing is a long game. Don't expect an awareness-stage blog post to drive conversions today. Sometimes the value is in planting seeds that convert months later.
Mistake 5: Not Segmenting by Traffic Source The same content might work great for people from email but poorly for people from paid ads. Always segment your data to understand these differences.
A Content Marketing Funnel Success Story
Here's what good content funnel tracking looks like in practice:
A B2B SaaS company realized they had great awareness content (blog posts getting thousands of views) but relatively few readers progressed to requesting a demo.
They used Rybbit to dig deeper. They discovered that a large portion of people who read awareness content never moved on to consideration content. Of those who did, the conversion to demos was higher. And of people who viewed the pricing page, a significant percentage submitted contact forms.
So their leak was at the awareness-to-consideration transition.
They tested adding a "next steps" section at the end of awareness blog posts, linking to relevant consideration content. They also added email signup CTAs.
After implementation, they saw a significant improvement in awareness-to-consideration conversion rates. More people moved deeper into their funnel, leading to more demo requests and sales opportunities.
They only discovered this problem because they had proper funnel tracking. Without Rybbit's insights, they would have kept writing more awareness content without addressing the actual leak in their funnel.
Conclusion
A content marketing funnel is how you turn attention into customers. But you can't optimize what you don't measure.
By implementing proper tracking with Rybbit, you can see exactly where people engage with your content, where they drop off, and which pieces drive actual business results.
Start by mapping your funnel stages, identifying key actions, and setting up goals in Rybbit. Then monitor your metrics and act on the insights. The best content marketing teams don't just create great content - they measure its impact and optimize continuously.
Your content marketing isn't just about traffic. It's about building a machine that turns awareness into customers. Rybbit helps you see how that machine is performing and provides the data you need to improve it at every stage.
Ready to get started? Check out Rybbit's documentation on Goals, Funnels, Journeys, and Custom Event Tracking to implement your content marketing funnel today.
Related Reading: